Alliance for California Traditional Arts
Leveraging Web and Social Media Analytics to Optimize ACTA's Digital Strategy and Boost Its National Reach
Client
Alliance for California Traditional Arts (ACTA)
Role
UX Researcher
Team
4 UX Consultants
Contribution
Google Analytics, Dashboard (Looker Studio), Social Media Analysis, Findings & Recommendations, Report & Presentation
Duration
6 Weeks
Tools
Google Analytics, Looker Studio, Frog, Moz, WordTracker, Page Speed Insights, Instagram Data
ORGANIZATIONAL GOAL
Increase traffic by engaging a broader, more diverse audience
We held an initial meeting with the client to define the project scope and objectives for their website — discussing their current analytics, digital strategy, and potential areas for improvement. ACTA outlined three primary objectives for the study:
01
Broadening ACTA's reach to a nationwide audience
02
Formulating a comprehensive social media strategy to strengthen their online presence
03
Increasing ACTA's visibility among users with general interest in traditional arts
METHODOLOGY
Gathering data from ACTA’s website and instagram
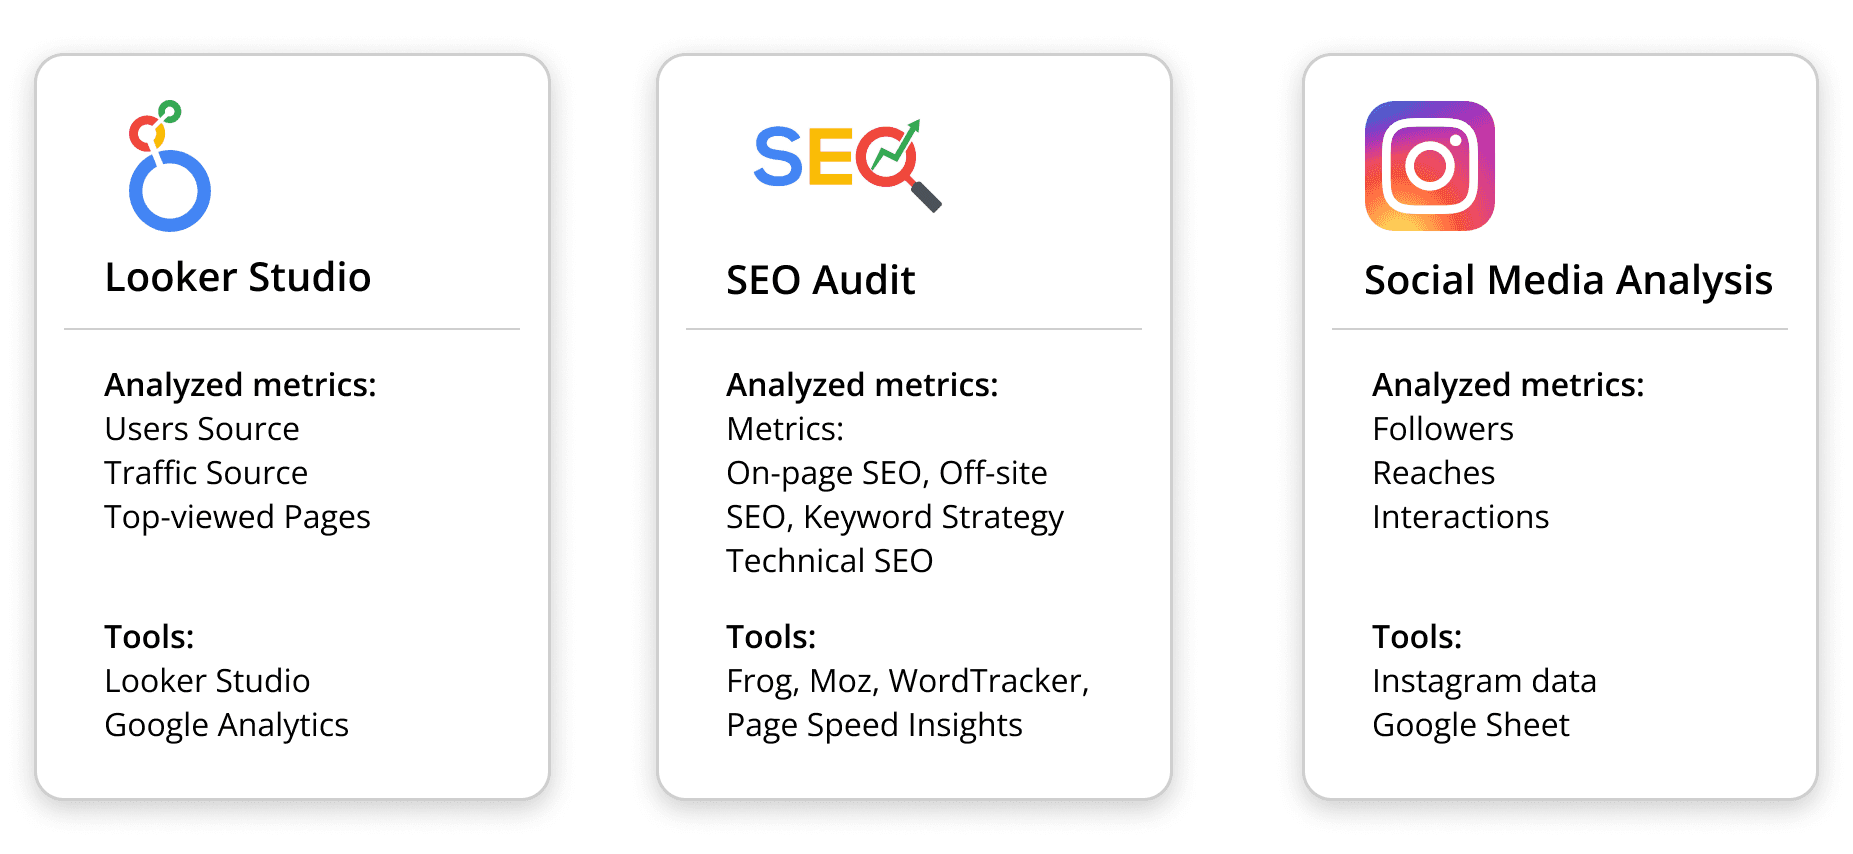
To evaluate the performance of ACTA’s digital channels with respect to these objectives, our team employed three main methods of analysis:
Development of a custom analytics dashboard
A SEO audit with a focus on keyword strategy
Review of metrics for posts on ACTA's main Instagram feed; @caltradarts.
01 ANALYTICS DASHBOARD
Creating a dashboard to monitor user behavior and gain initial insights
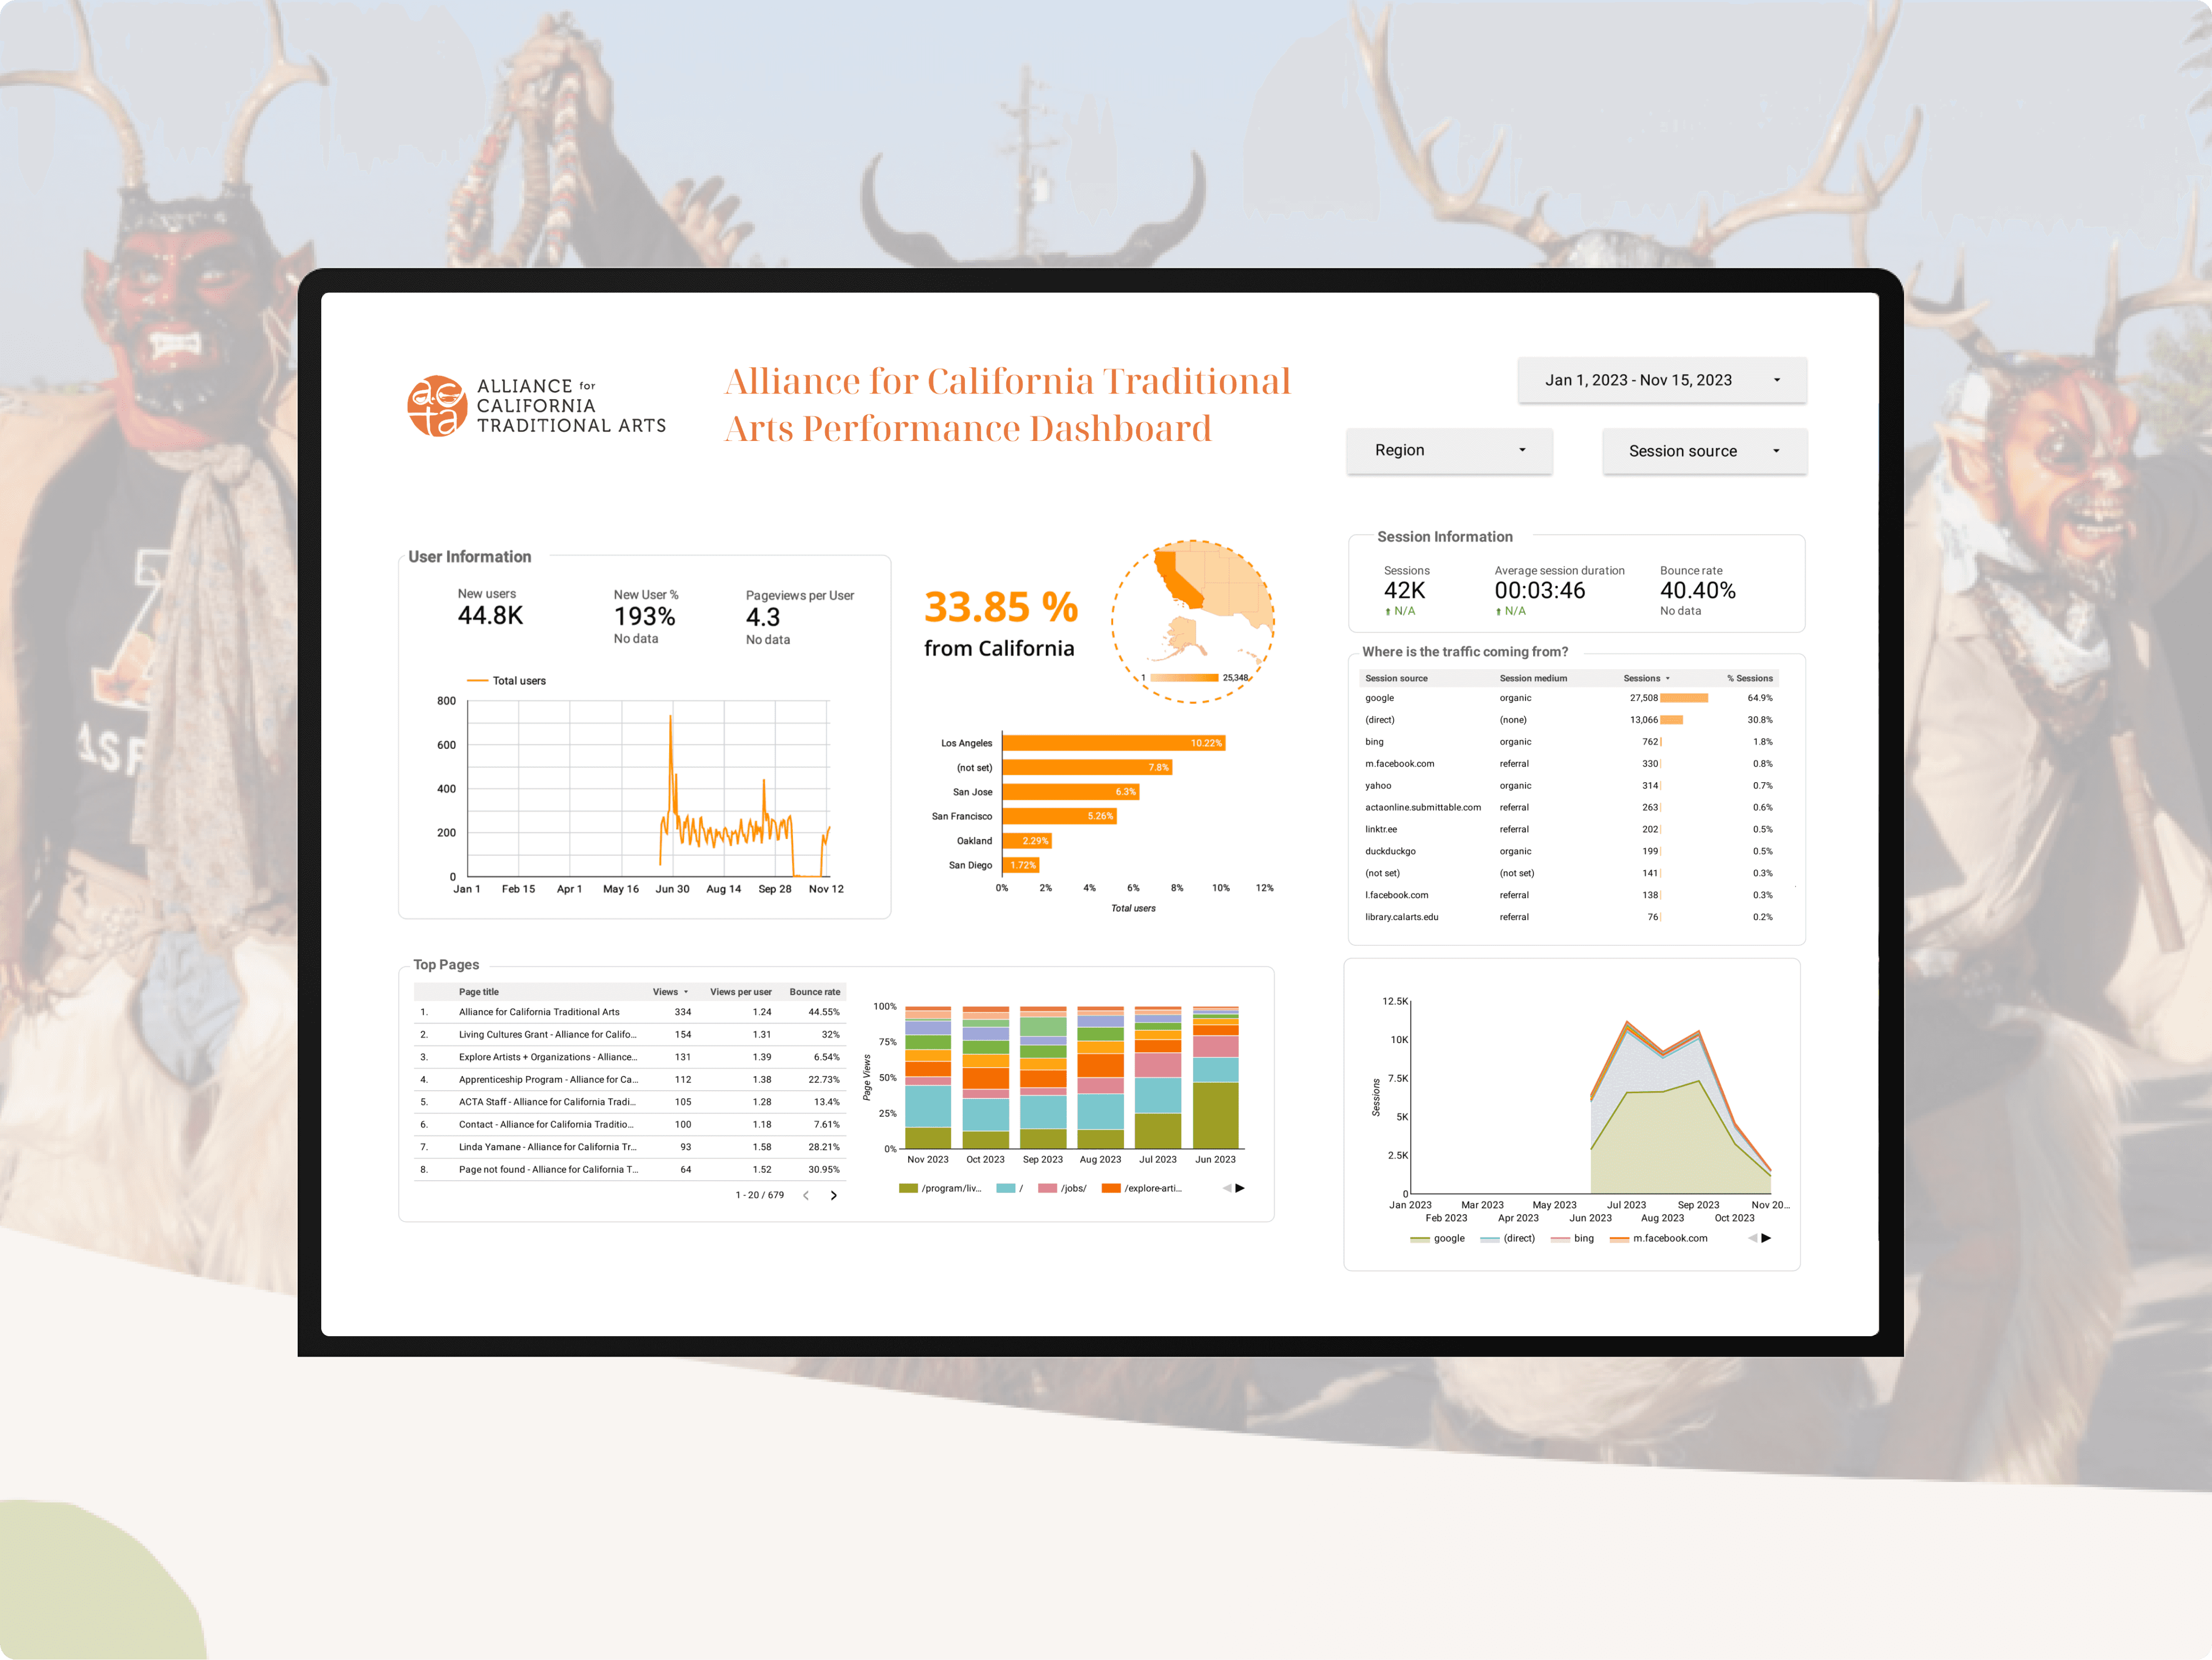
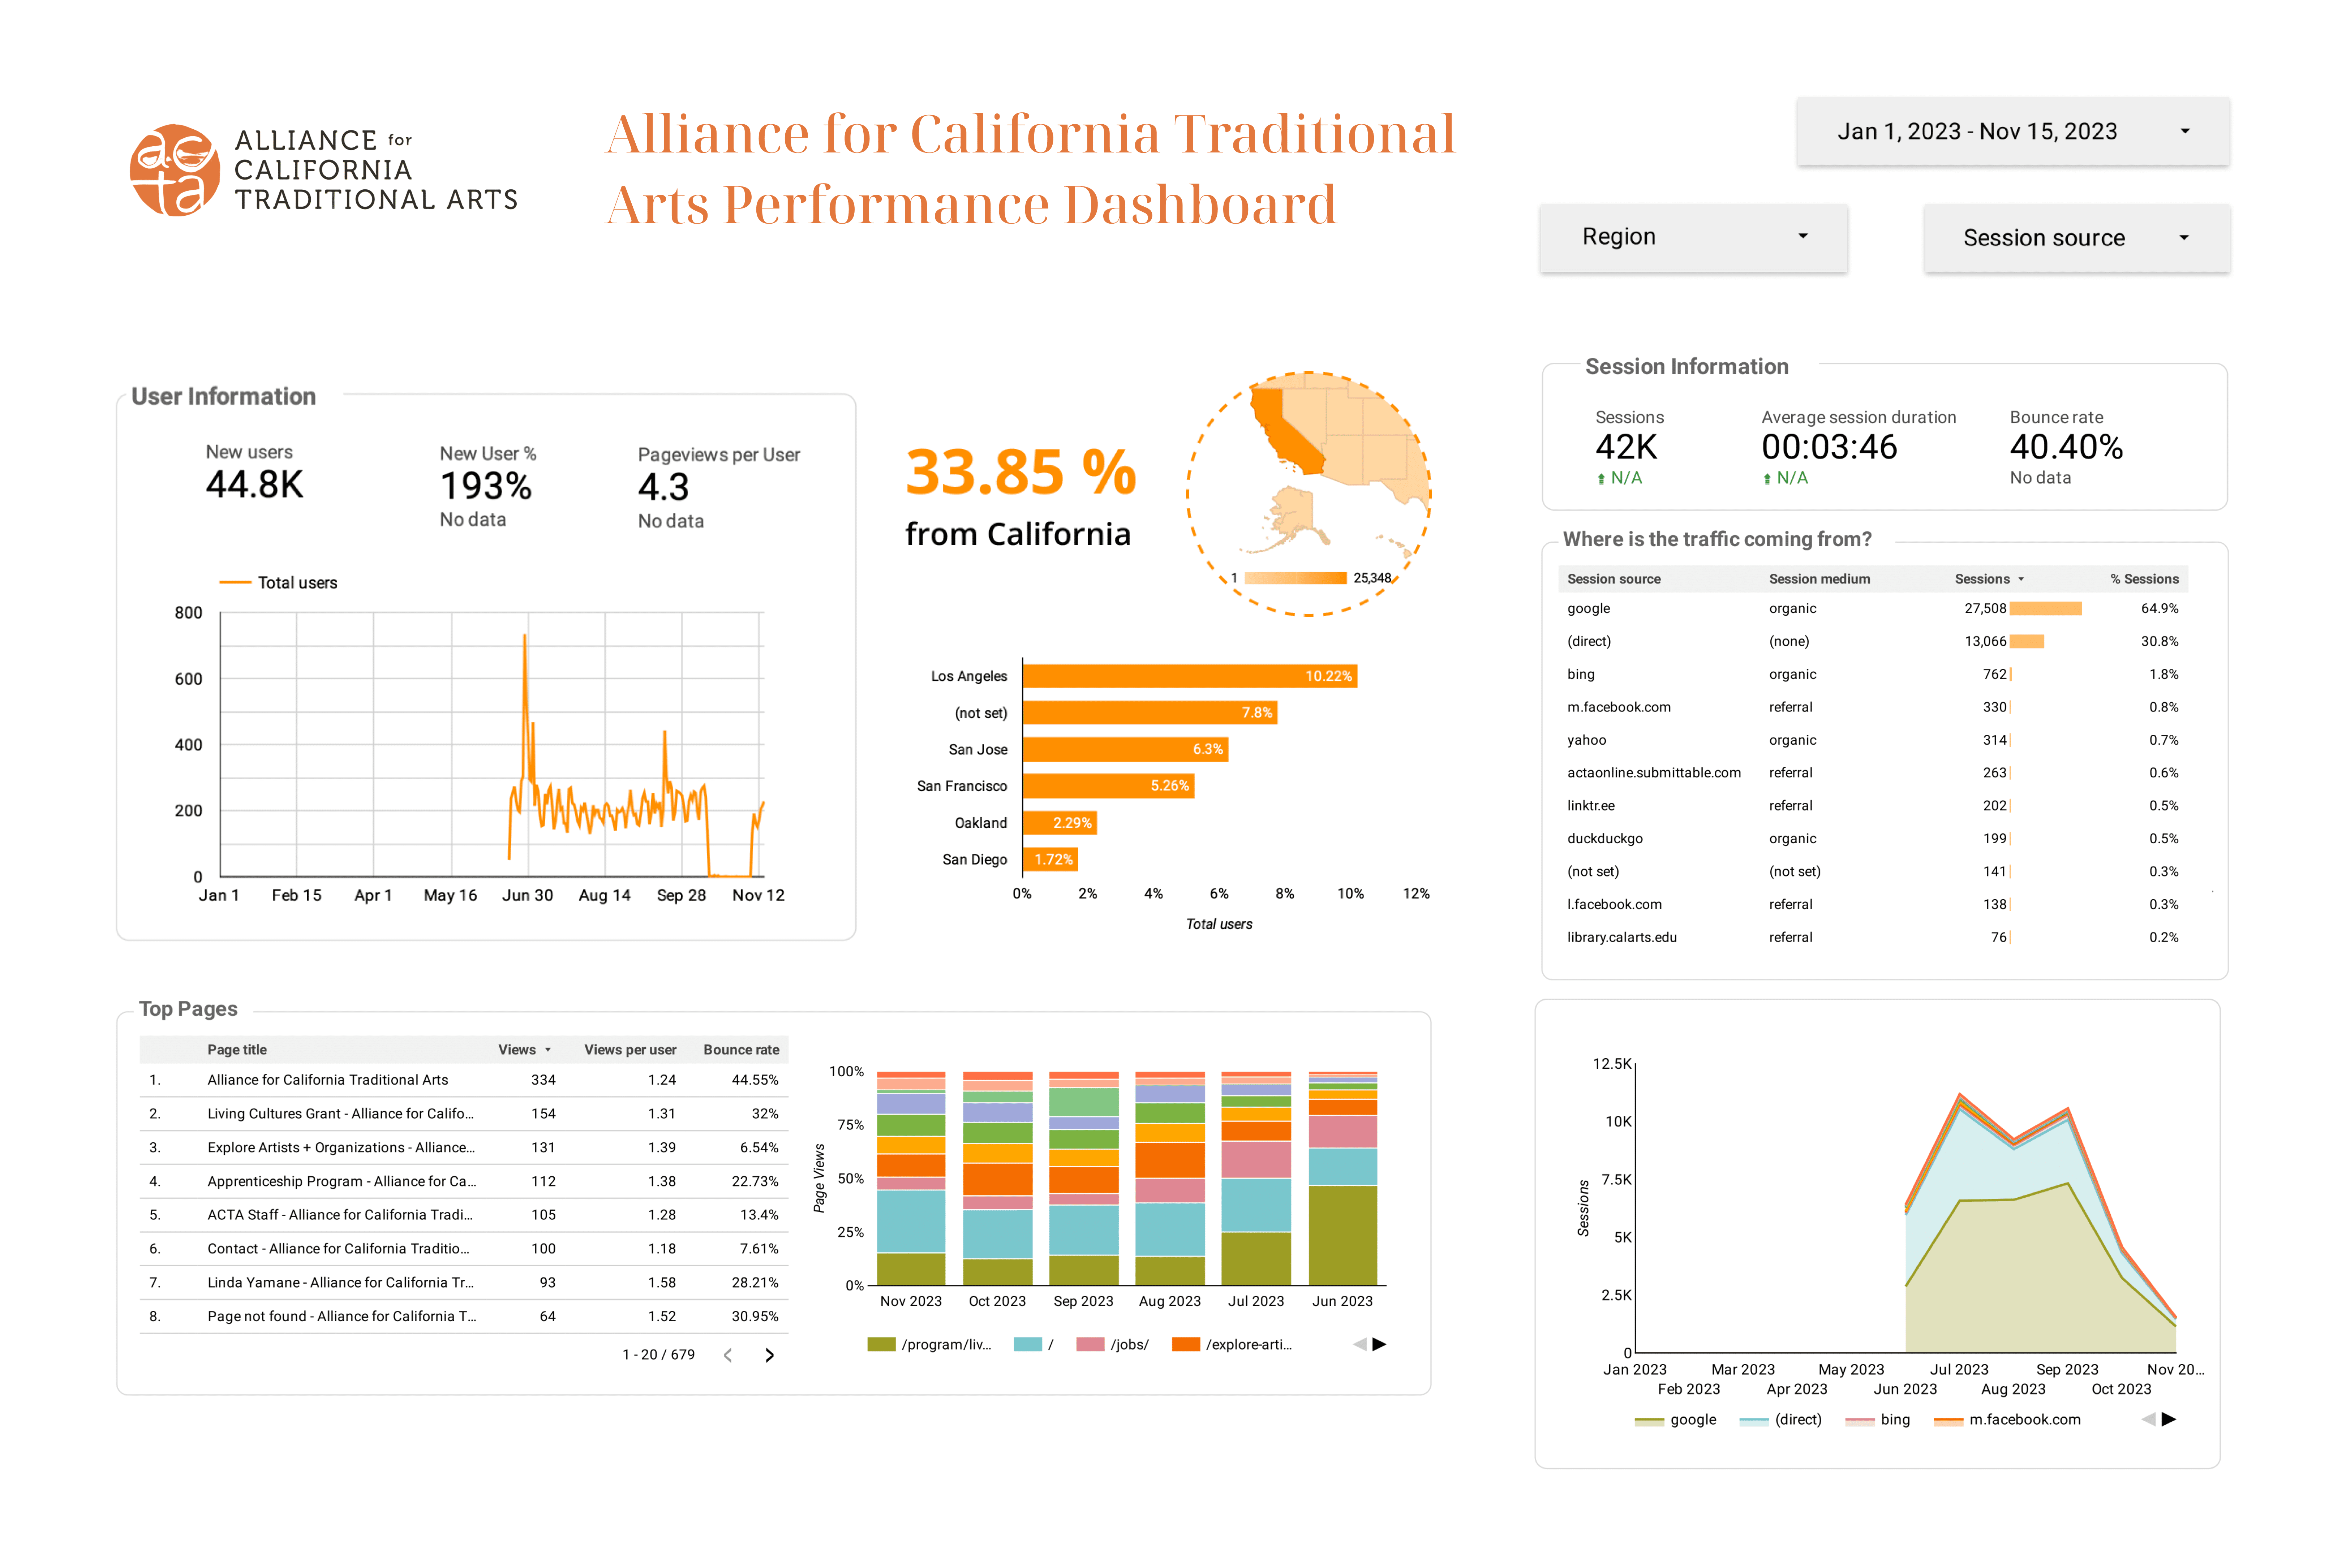
We analyzed ACTA’s Google Analytics data from January 1st, 2023 to November 15th, 2023 to understand the demographics of users, their geographic location and how they interacted with the website. I created a dashboard using Looker Studio to have an overview of relevant data and focus on segments that spoke to the key objectives:
User behavior, Session information, Source of user, Devices usage, Top viewed pages, and Source of traffic.
02 SEO AUDIT
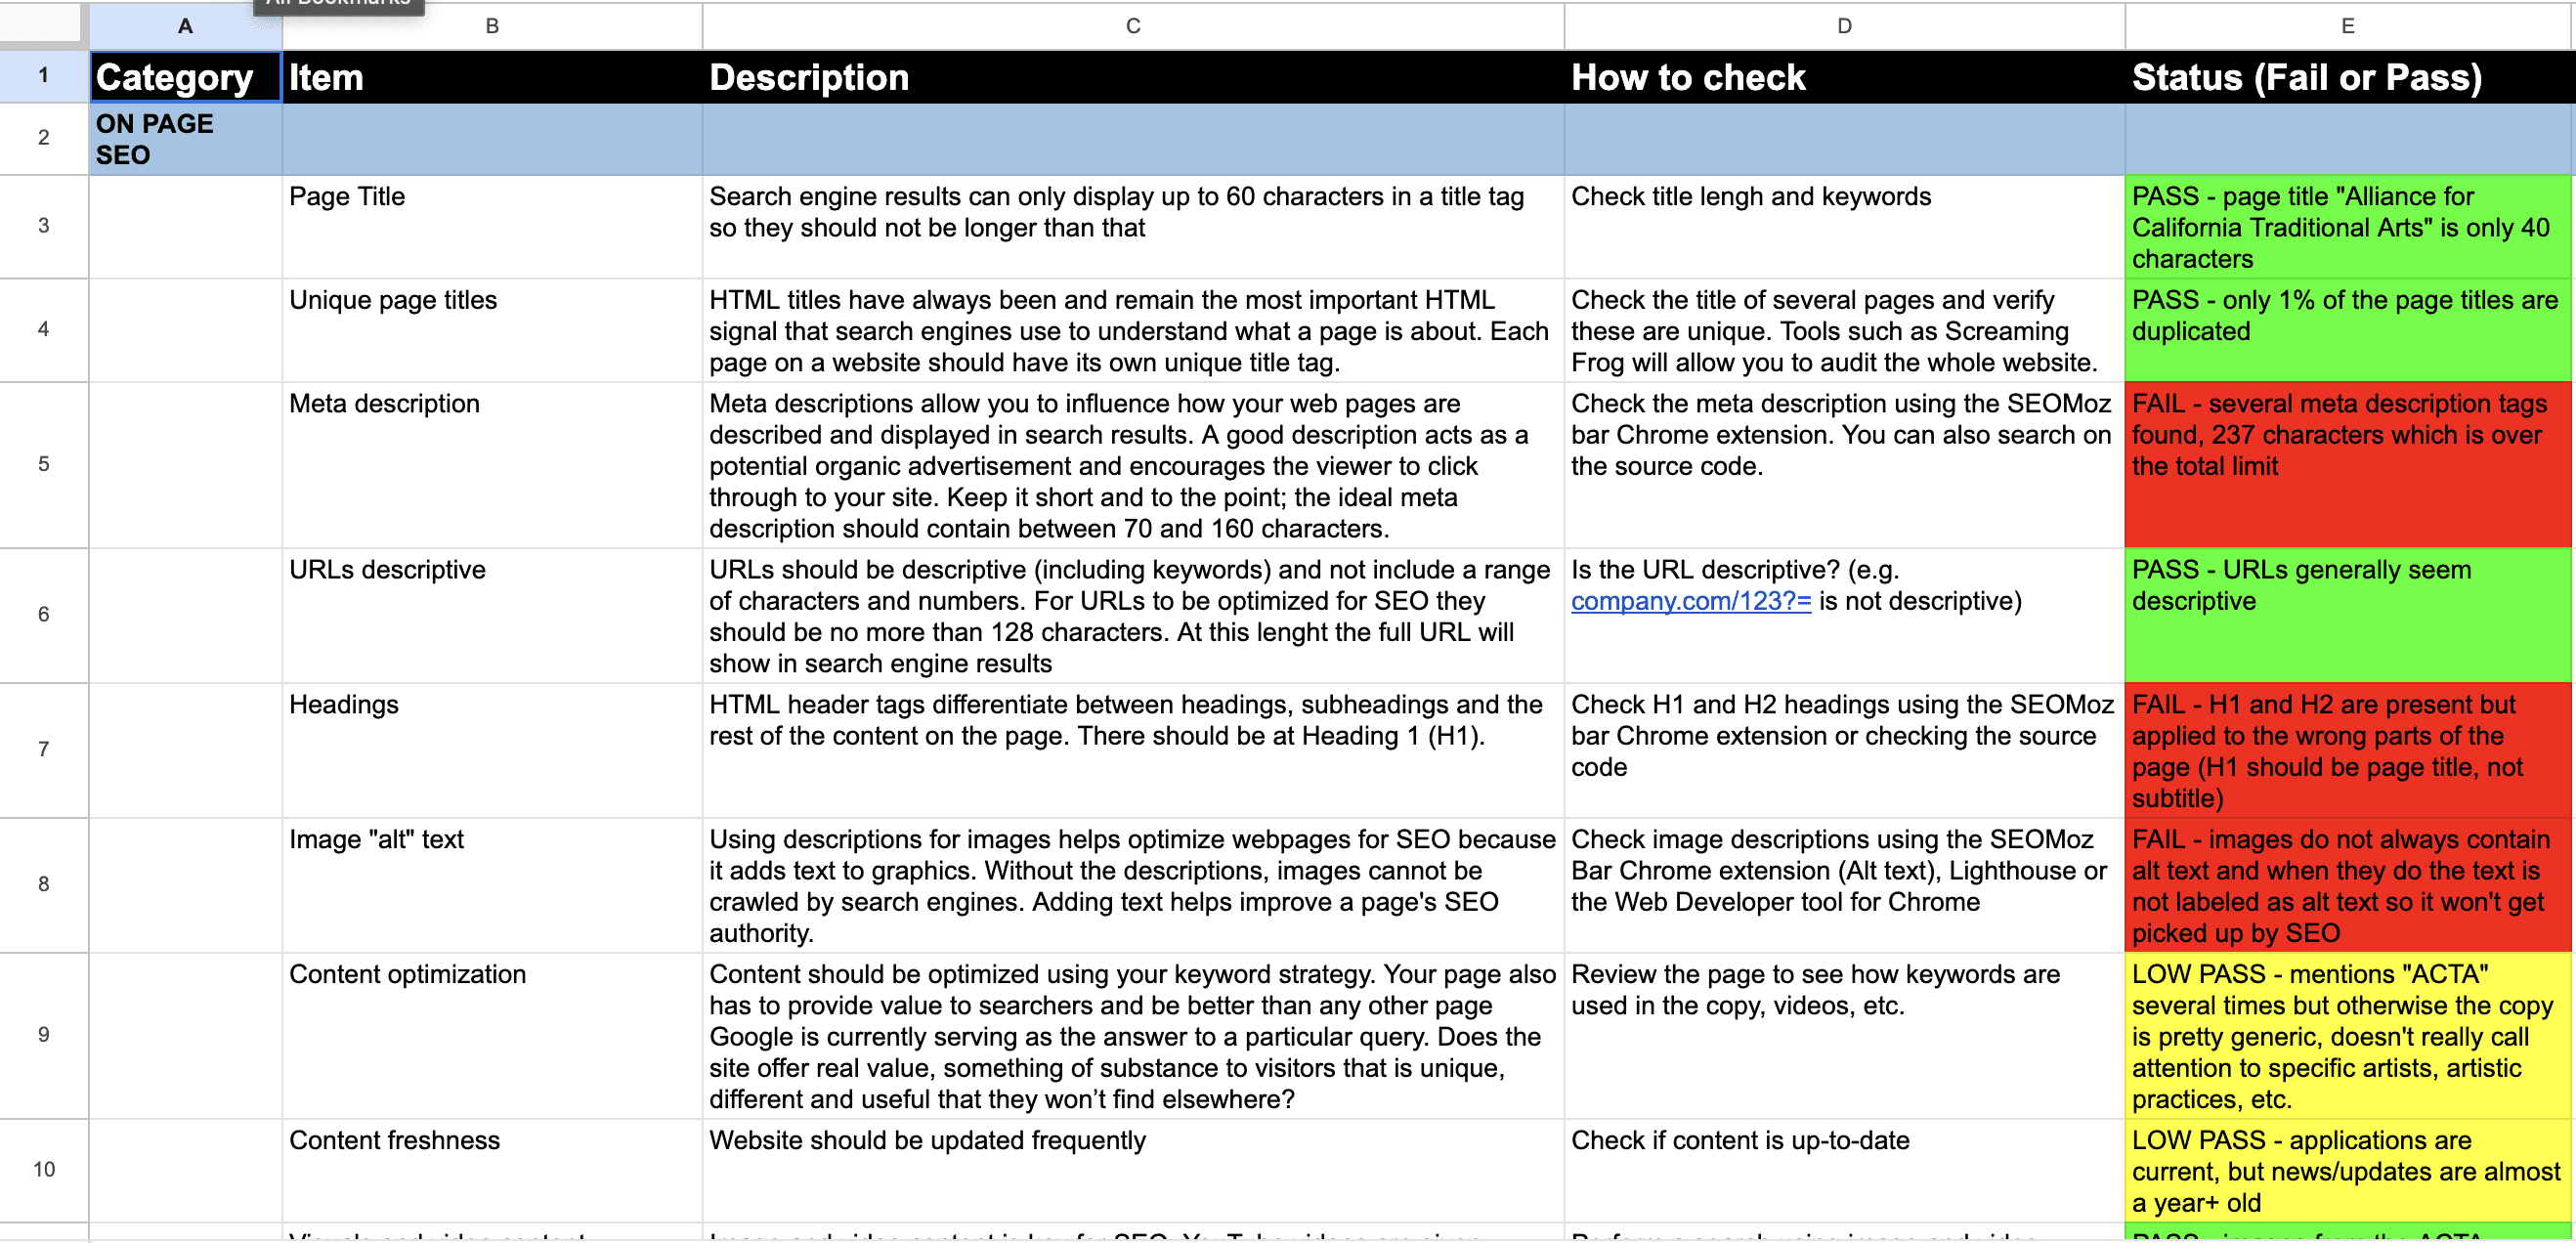
Evaluating ACTA's SEO performance and areas of improvement
03 SOCIAL MEDIA ANALYTICS
Analysis of ACTA's instagram
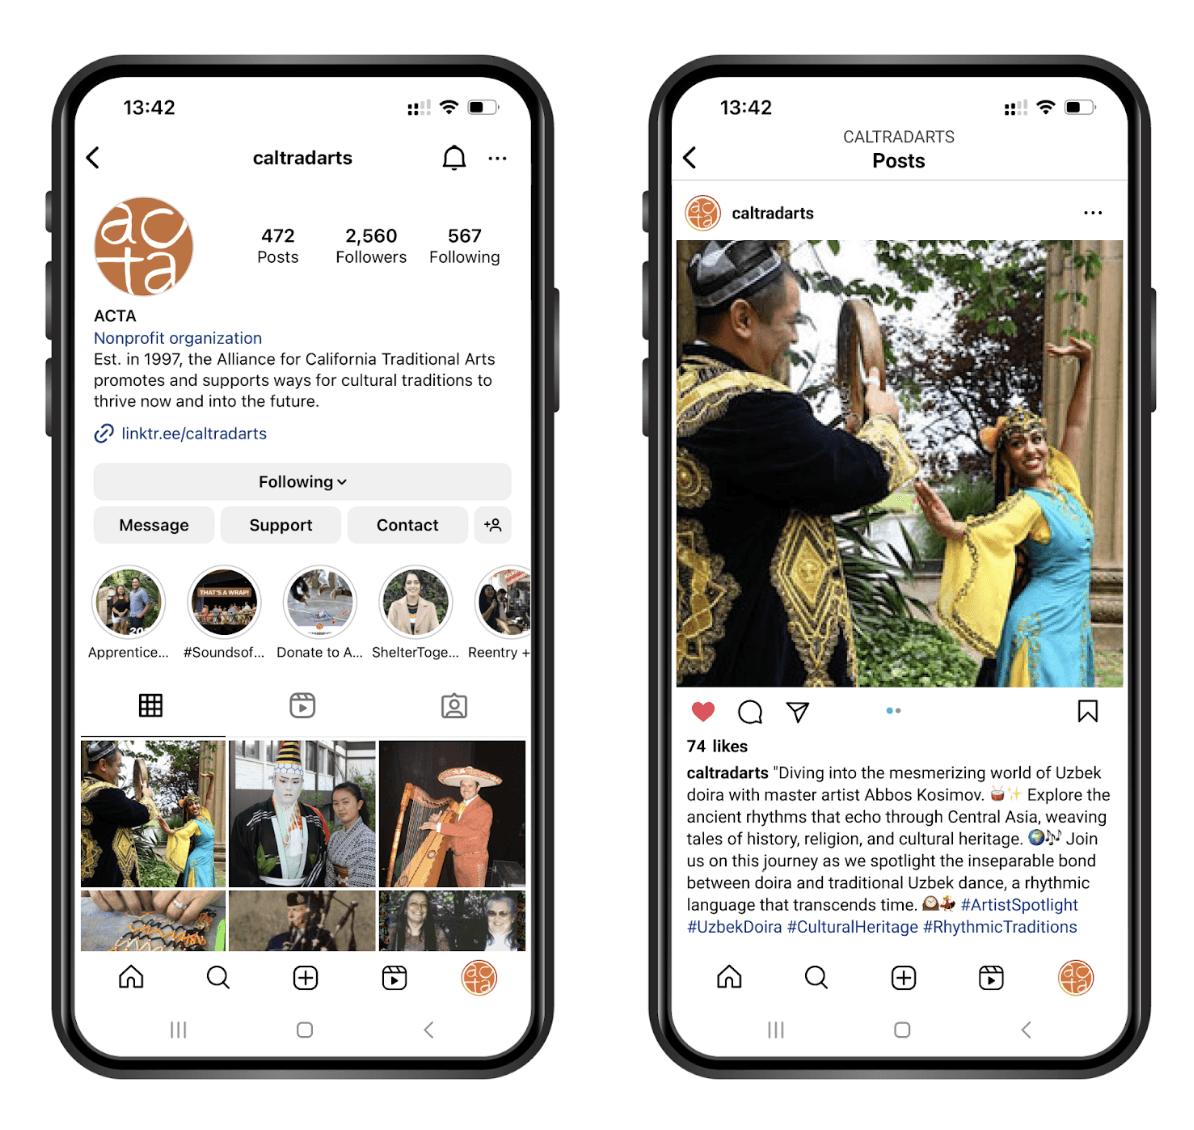
Our social media analysis focused on ACTA’s Instagram account, @caltradarts. We used a combination of analytics data provided by ACTA for posts between July 203 - December 2023, and raw analysis of likes and engagement of all-time posts appearing on the @caltradarts feed. The metrics considered were: Followers, Reach, and Interactions.
FINDINGS & RECOMMENDATIONS
Key insights from analyzing ACTA's digital channels
Based on the data collected and analyzed, an overview of the findings and recommendations we’ve observed:
Findings
Majority of visitors to the website are new users and from organic searches.
Broken and outdated links on website
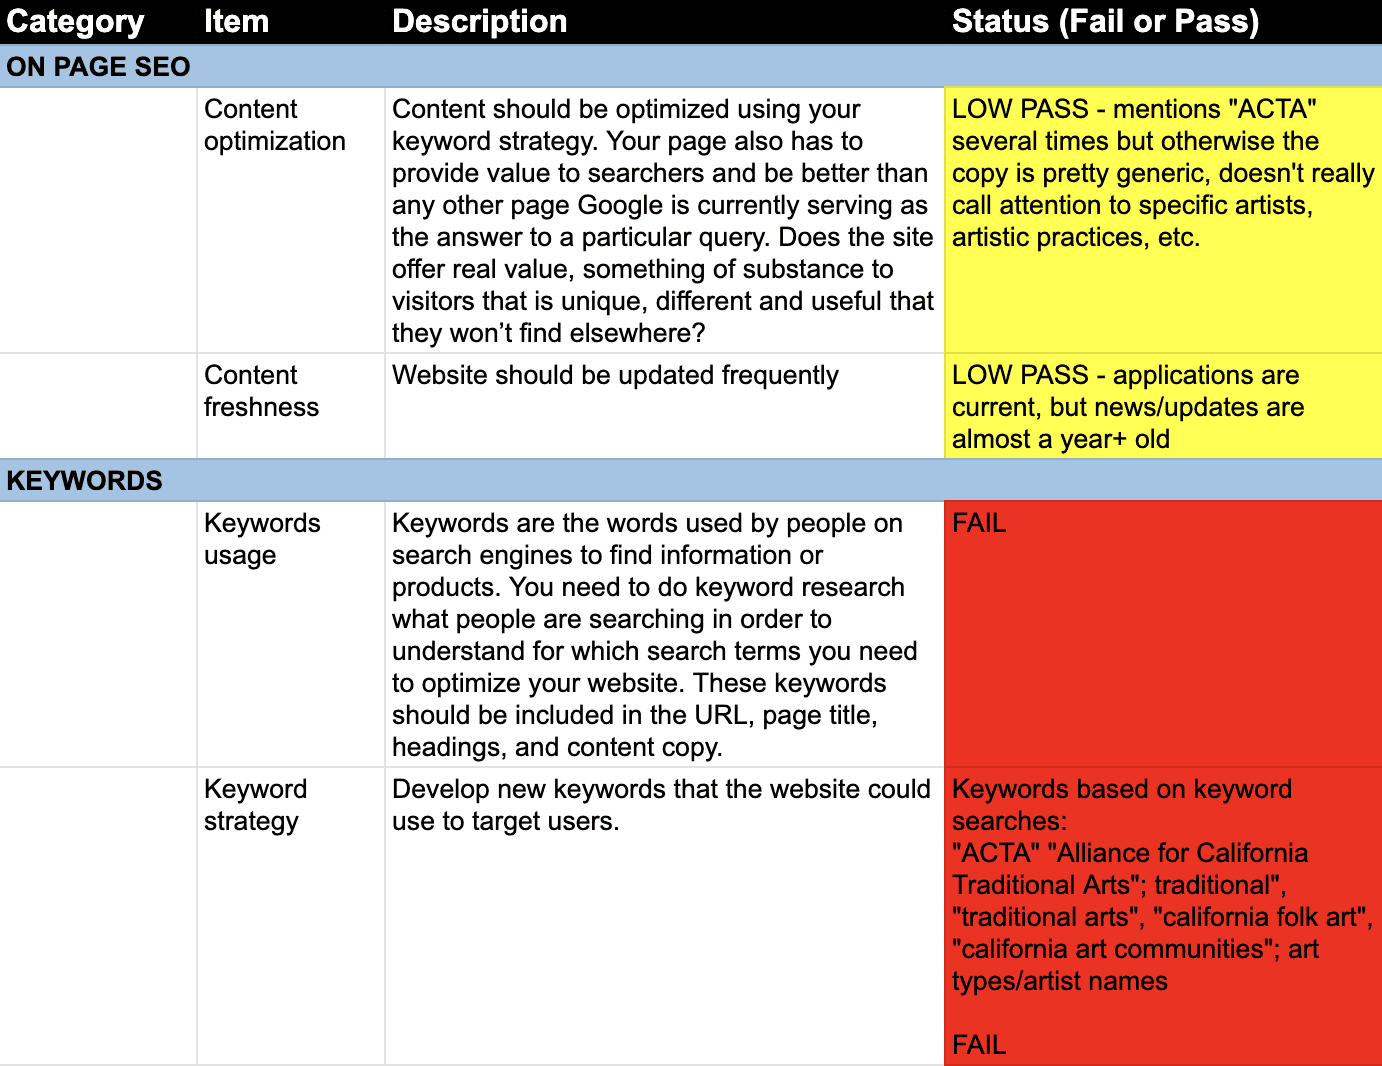
Keyword strategy of website is not aligned with the words that usually drive traffic
Site speed rating is negatively impacted by load speed issues due to image content
Users prefer posts about the ACTA community compared to posts that are a call to action
Recommendations
Tailor content to the interests and needs of users from other places
Audit and update links on website and campaigns
Supplement or replace general terms with specific keywords
Ensure images are following recommended guidelines to optimize site speed
Leverage the ACTA Instagram primarily as a place to share information about the community
FINDING 1
Majority of visitors to the website are new users
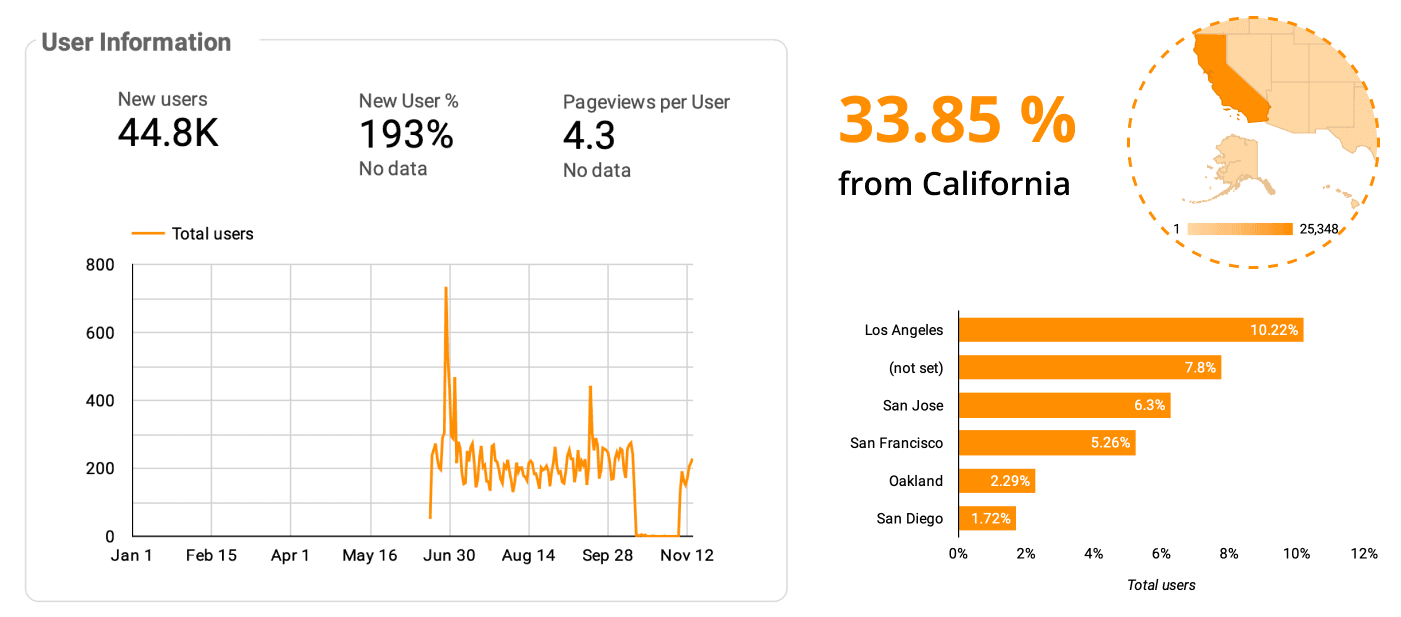
Most visitors to the ACTA’s website are newcomers, that is new users to the website are 76% more than current active users. With the majority originating from the Bay Area, United States. Following visitors from within the California region, (33.85%) the next largest group of visitors are from New York (1.85%).
Fig: Segmentation of users by region; showing percentage of users from different cities
Primary source of traffic is organic searches
The majority of visitors to the website accessed the website through organic searches (63.7%), utilizing Google as their search engine. Additionally, a slightly larger number of visitors prefer accessing the website on desktop (53.7%), with the rest opting for mobile access (44.9%).
Fig: Table and chart showing the sources of traffic to the website
RECOMMENDATION 1
Tailor content to the interests and needs of users from other places
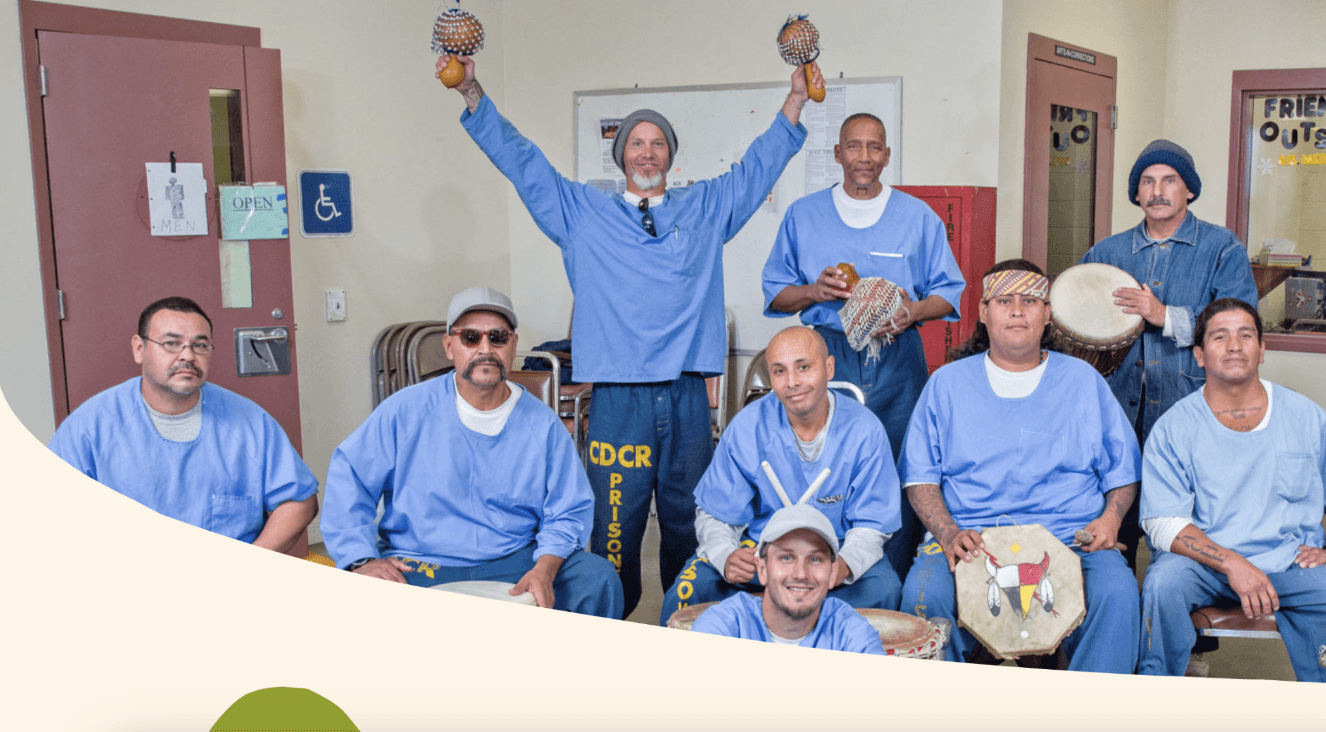
In order to enhance visibility and broaden the geographical reach of the website's audience, it is essential to tailor content according to the interests and requirements of users from across the country. By emphasizing traditional arts and cultural traditions promoted by ACTA, we can reach a wider audience across the country, who aren’t from California but are interested in different folk and traditional art.
Fig: ACTA’s Arts in Corrections program offers traditional arts workshops in 18 prisons, like this African drumming workshop at Valley State prison in Chowchilla, CA. Photo: Peter Merts
FINDING 2
Broken and outdated links on website
The 8th-ranking top page view loads a “Page not found” error, with 64 views within the last 28 days. The page has 1.52 views per user, higher than other top viewed pages which hover around 1.2, and has a deficient engagement time of 4 seconds compared to roughly 50 seconds for other top pages.
Fig: List of top pages visited by the users on the website
RECOMMENDATION 2
Audit and update links on website and campaigns
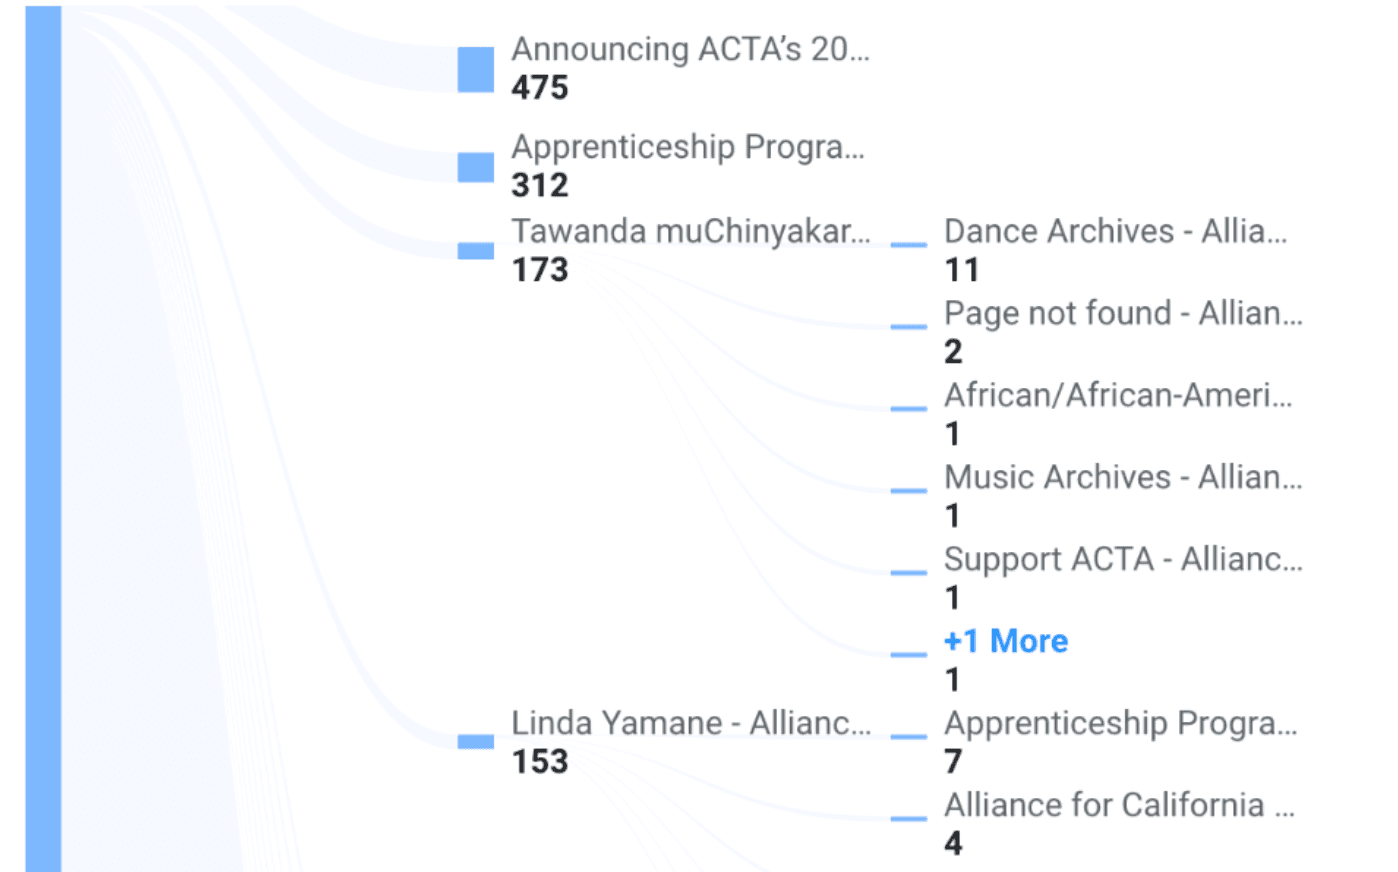
Through path exploration, we found that the “Page not found” errors tend to load from attempts to view the “Tawanda muChinyakara” page. A thorough audit should be conducted to identify and rectify incorrect links on the website, and address the "Page not found" errors, particularly linked to the “Tawanda muChinyakara” page, ensuring accurate and up-to-date links.
Fig: The exploration path located the “page not found” errors
FINDING 3
Keyword strategy of website is not aligned with the words that usually drive traffic
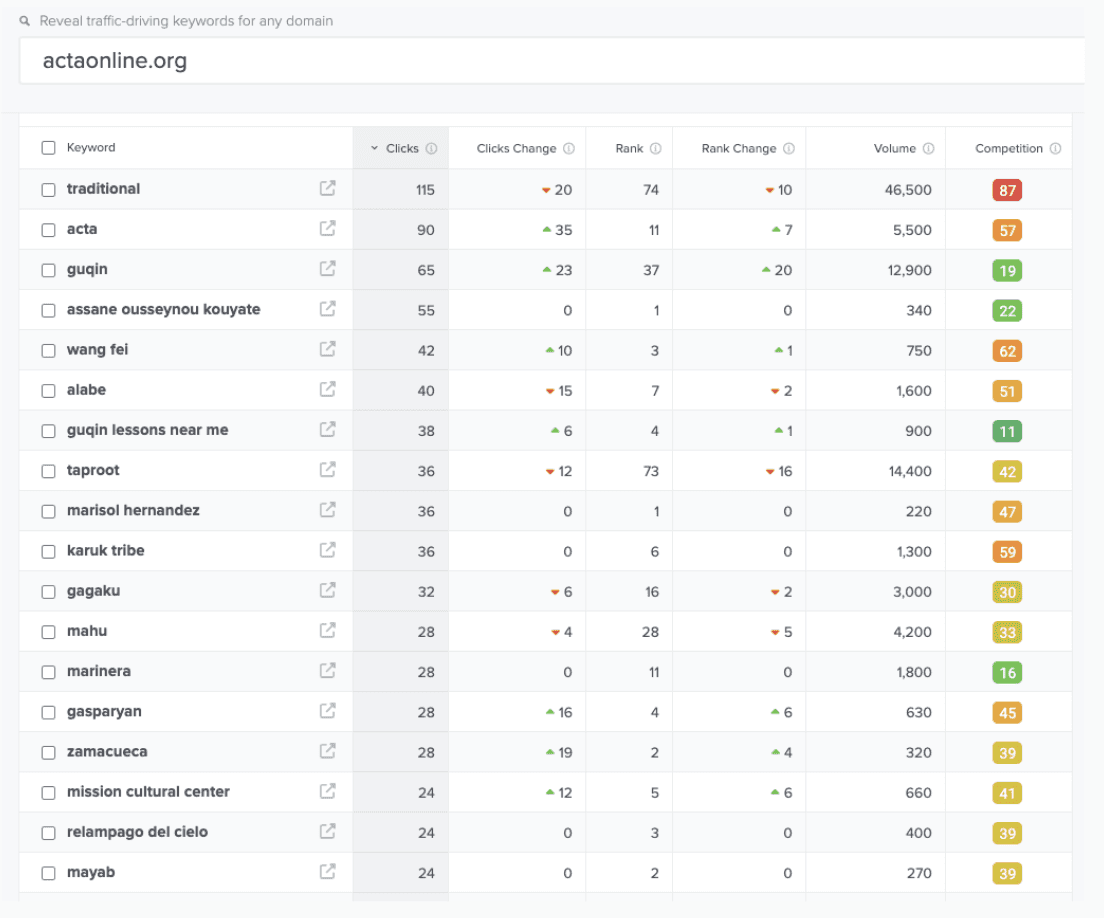
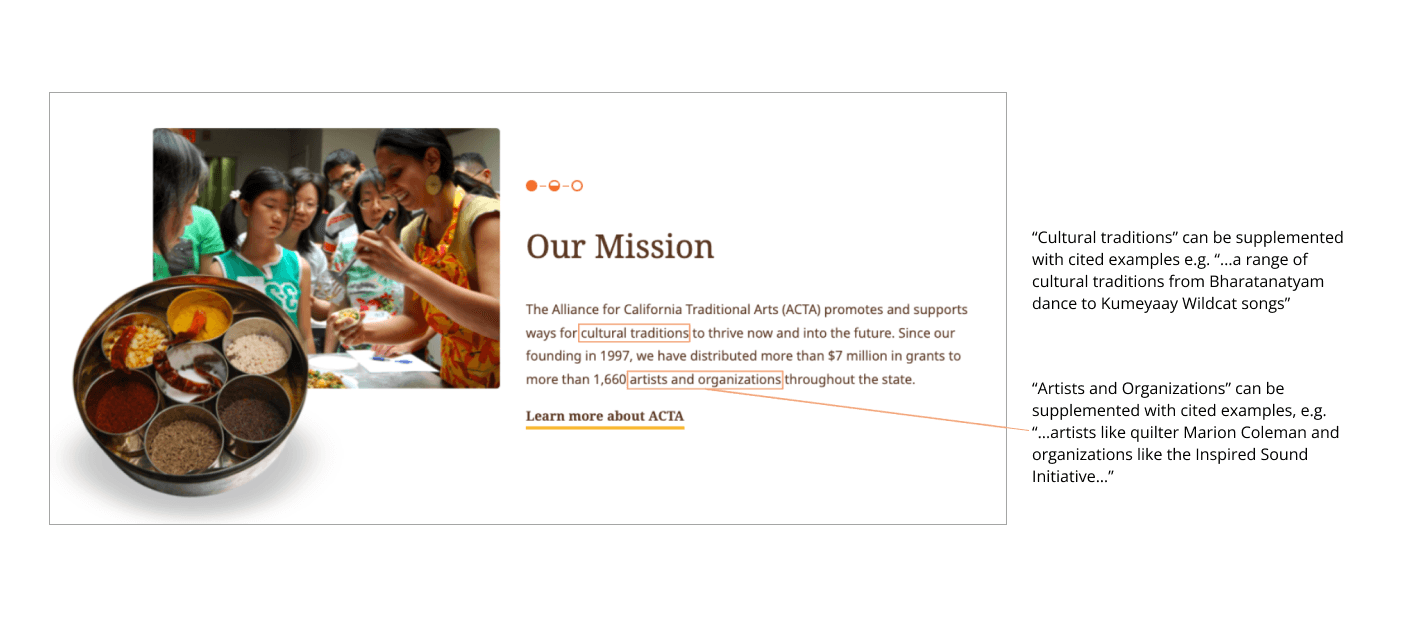
Many of the traffic-driving keywords for ACTA’s website are specific search terms related to traditional arts, such as the names of specific artists (Marisol Hernandez), instruments (guqin), and art forms (gagaku). However, analysis of copy on the homepage shows that ACTA clearly favors general references to “cultural traditions'', “artists” and “organizations”.
Mismatch between the website’s keyword strategy and the target user group’s preferred keywords will negatively impact SEO.
Fig: Results of a WordTracker search for traffic-driving keywords on the actaonline.org domain, showing a preference for specific keywords pertaining to traditional arts among users
RECOMMENDATION 3
Supplement or replace general terms with specific keywords
While general search terms speak more to ACTA’s, leveraging specific keywords such as the names of artists, art forms, and organizations that ACTA has worked with and supported in the past is likely to attract users who have an interest in the arts. ACTA should shift its focus away from general keywords and replace or expand upon the homepage copy with specific names.
Fig: Screenshot of copy from the actaonline.org homepage displaying general keyword strategy currently employed by ACTA
FINDING 4
Site speed rating is negatively impacted by load speed issues due to image content
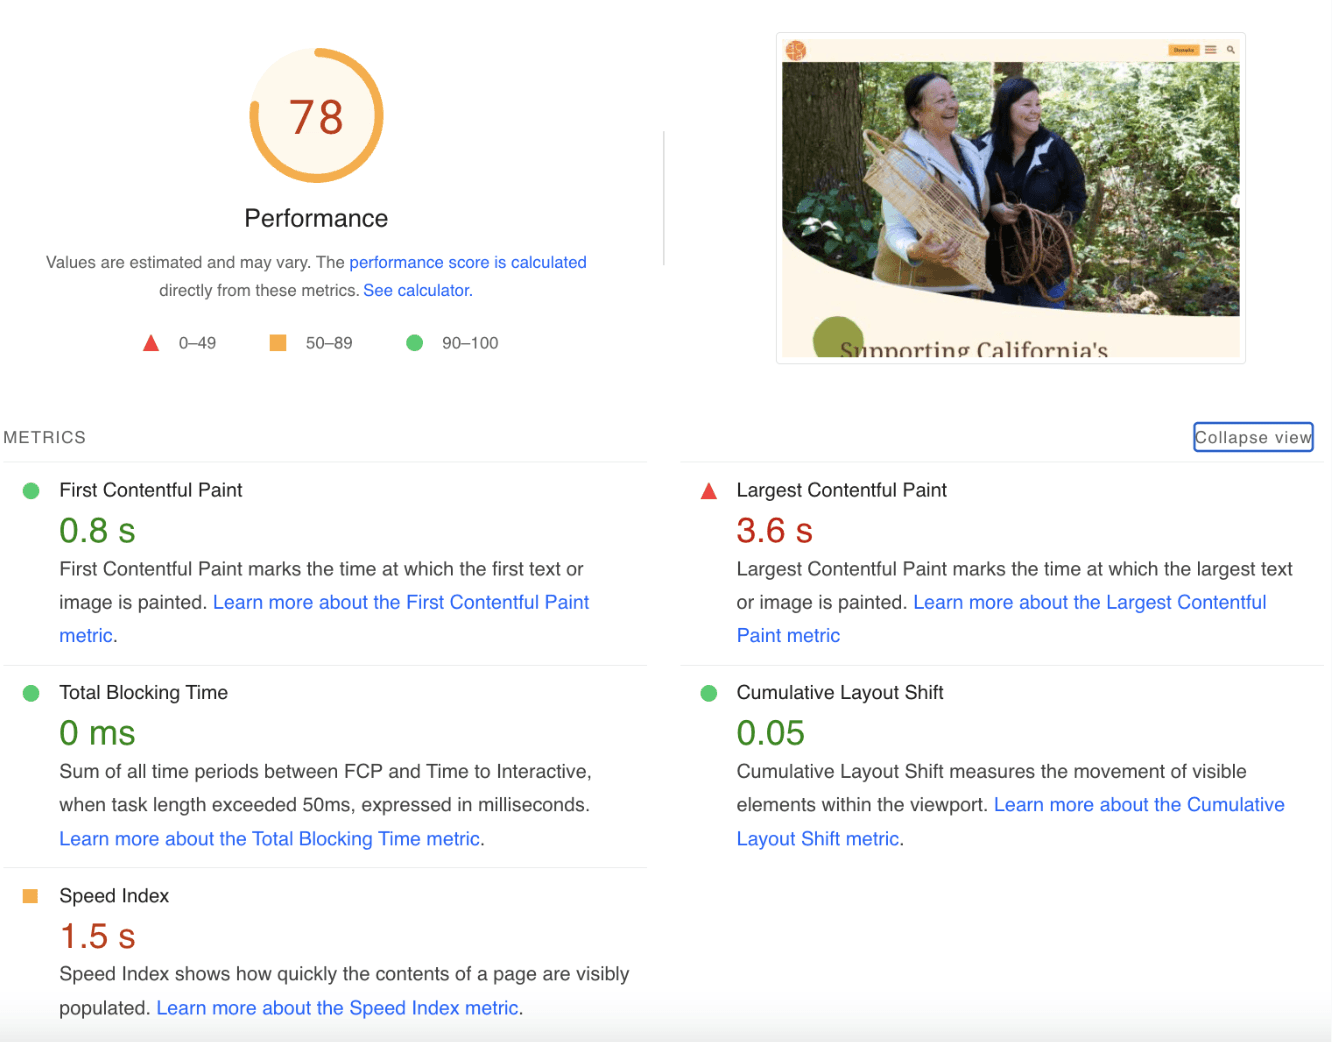
The site speed of ACTA is being brought down by load speed issues which are specifically related to image content. In particular, ACTA’s LCP and Speed Index are both in need of improvement and contributing to the website’s slow site speed. A low site speed can impact website’s SEO because users are less likely to wait for a page to load in order to engage with it.
Fig: Summary of insights from Google Page Speed Insights tool, identifying ACTA’s Largest Contentful Paint and Speed Index as the factors primarily contributing to slow site speeds
RECOMMENDATION 4
Ensure images are following recommended guidelines to optimize site speed
We’ve identified three technical dimensions along which image integration can be improved on the ACTA website:
Utilize Next-Gen Formats
Newer image formats like WebP or AVIF offer better image compression than traditional formats like JPEG and PNG without sacrificing image quality.
Properly Size Back-End Images
Images should be sized at the back-end for the size they appear on the front-end interface; oversized back-end images slow down front-end loading.
Efficiently Encode Images
Ensure images are efficiently encoded - using tools like content delivery networks and strategies like lazy loading.
Fig: Summary of recommendations from Google Page Speed Insights tool, recommending technical improvements be made to images on the ACTA website in order to improve site speed.
FINDING 5
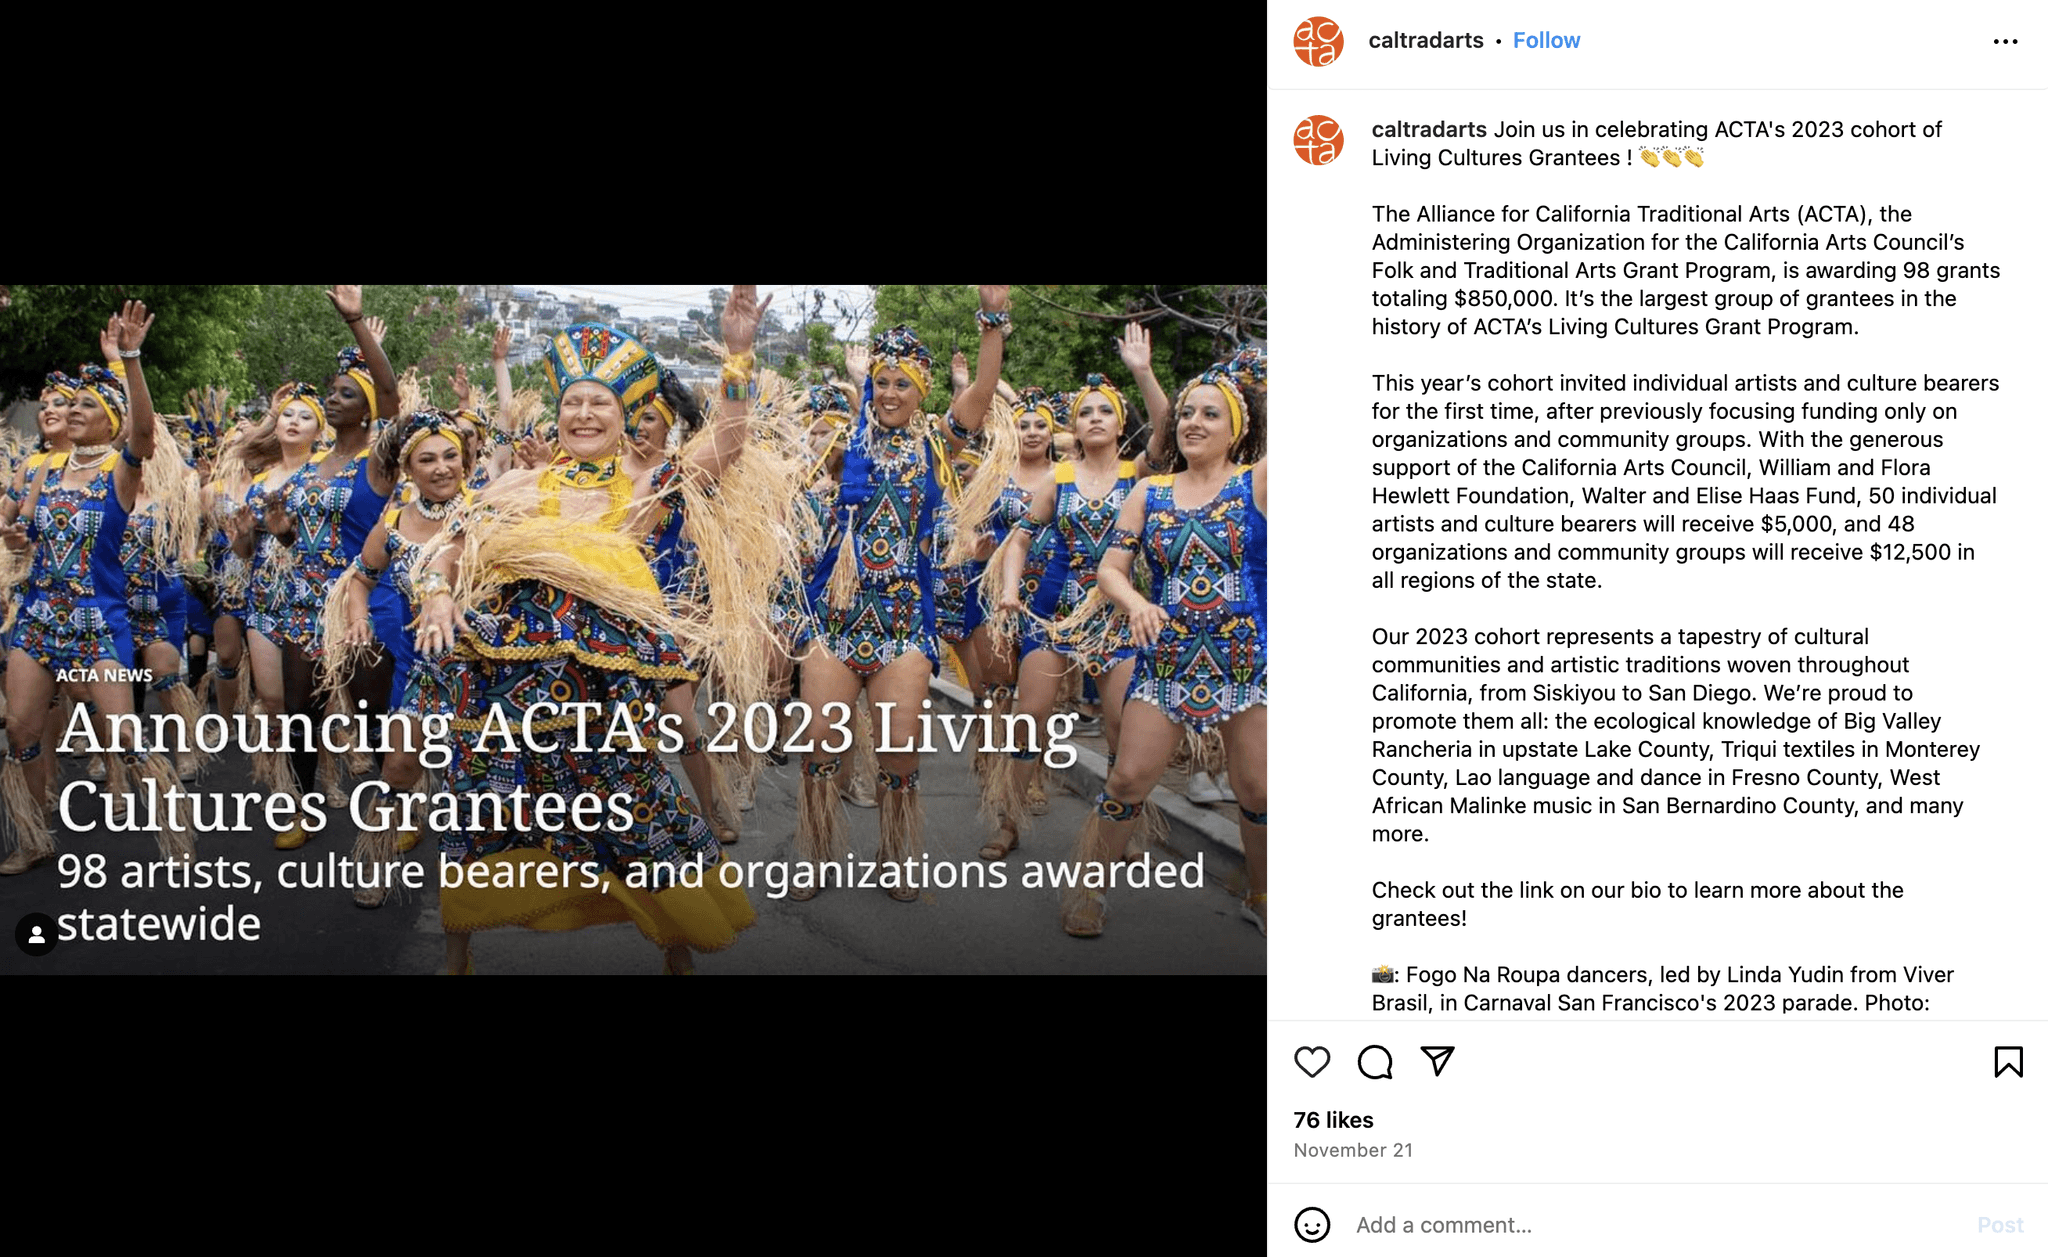
Simple posts generally perform better than those with complex design elements
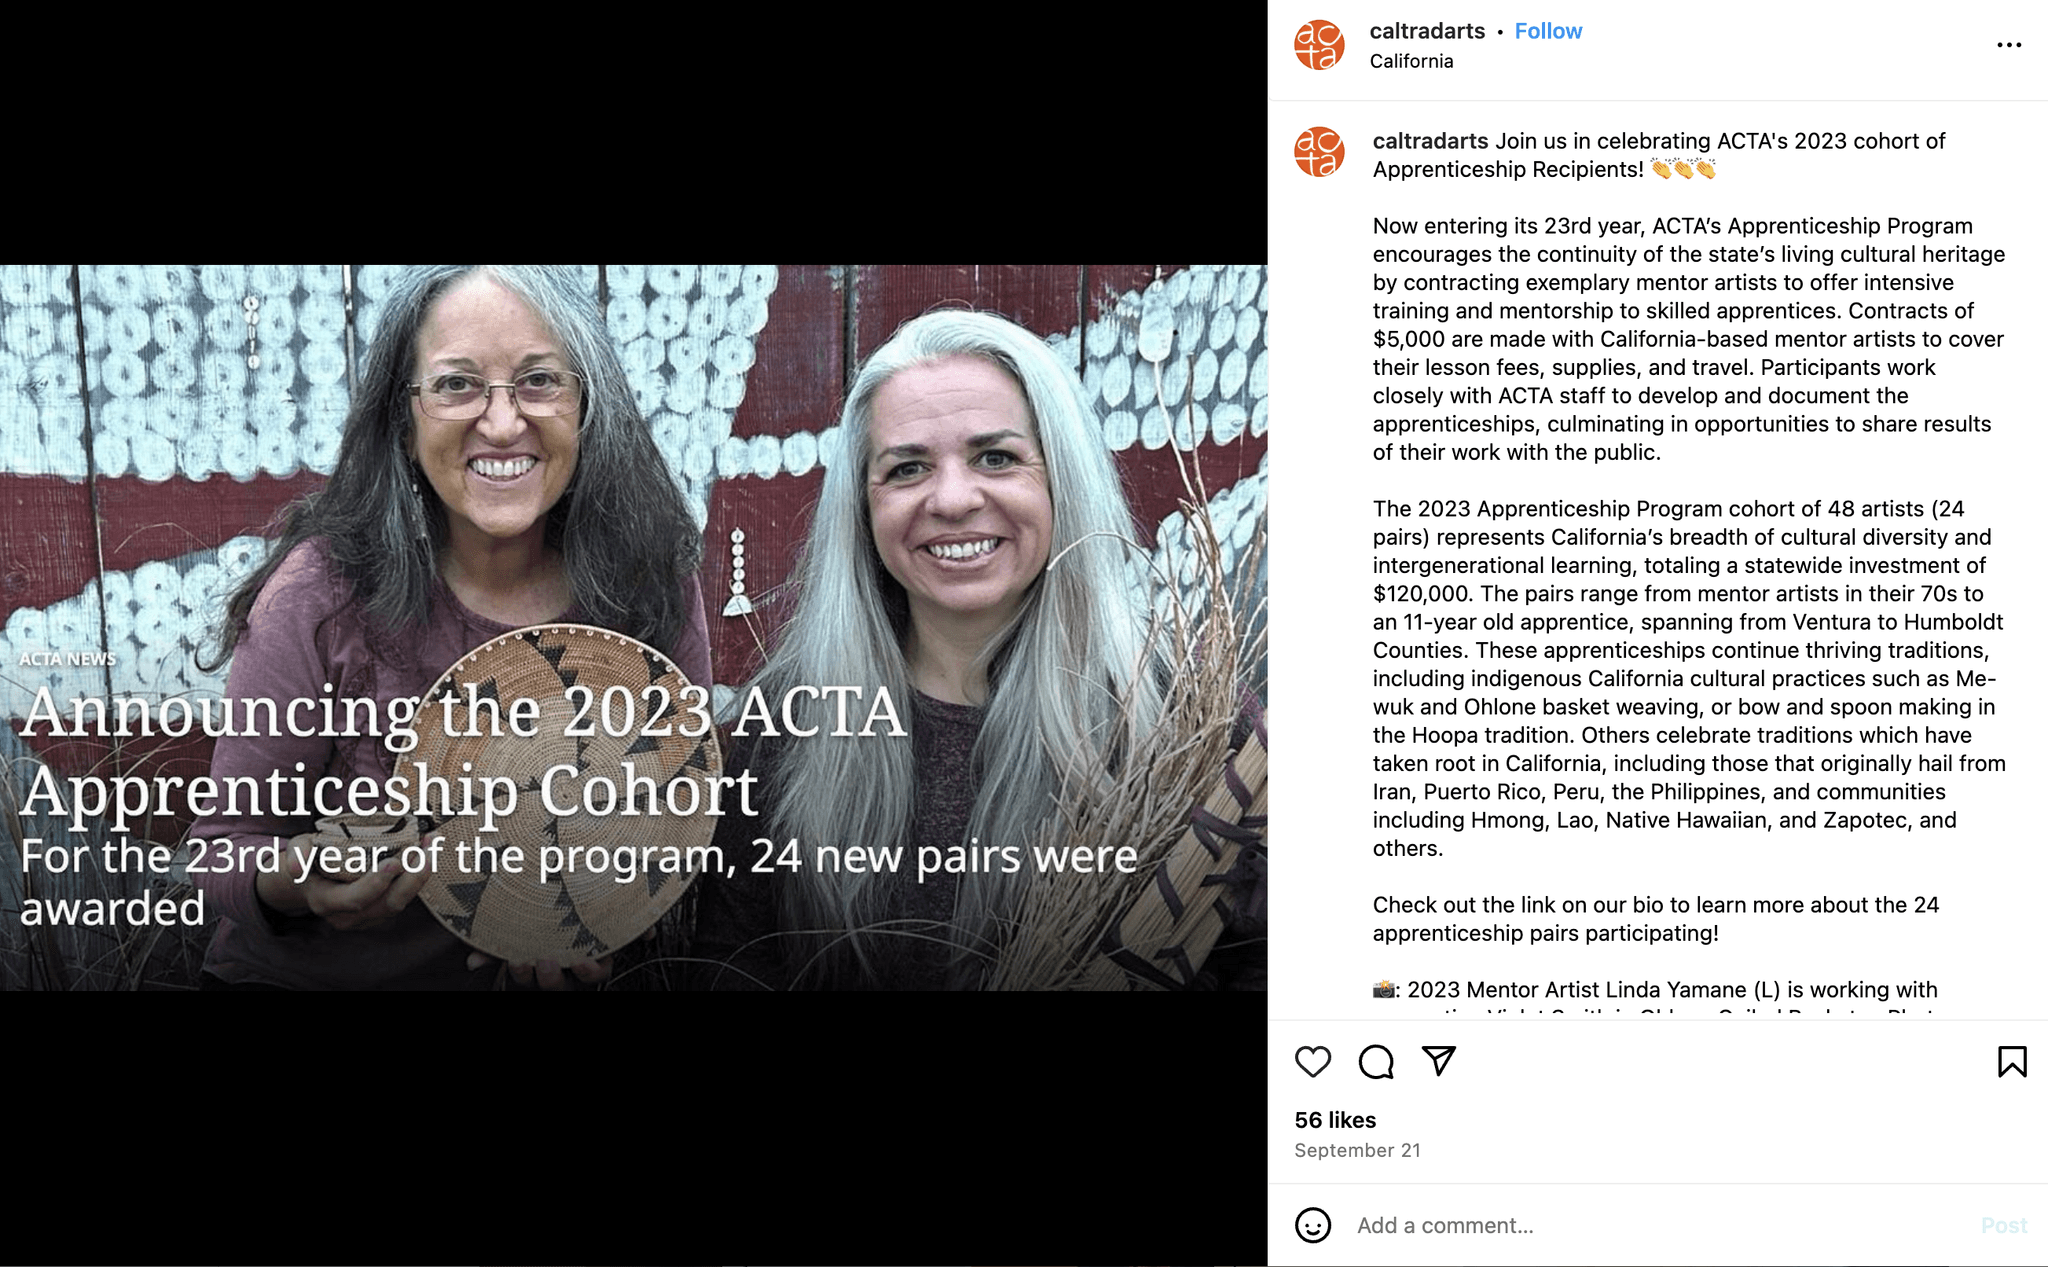
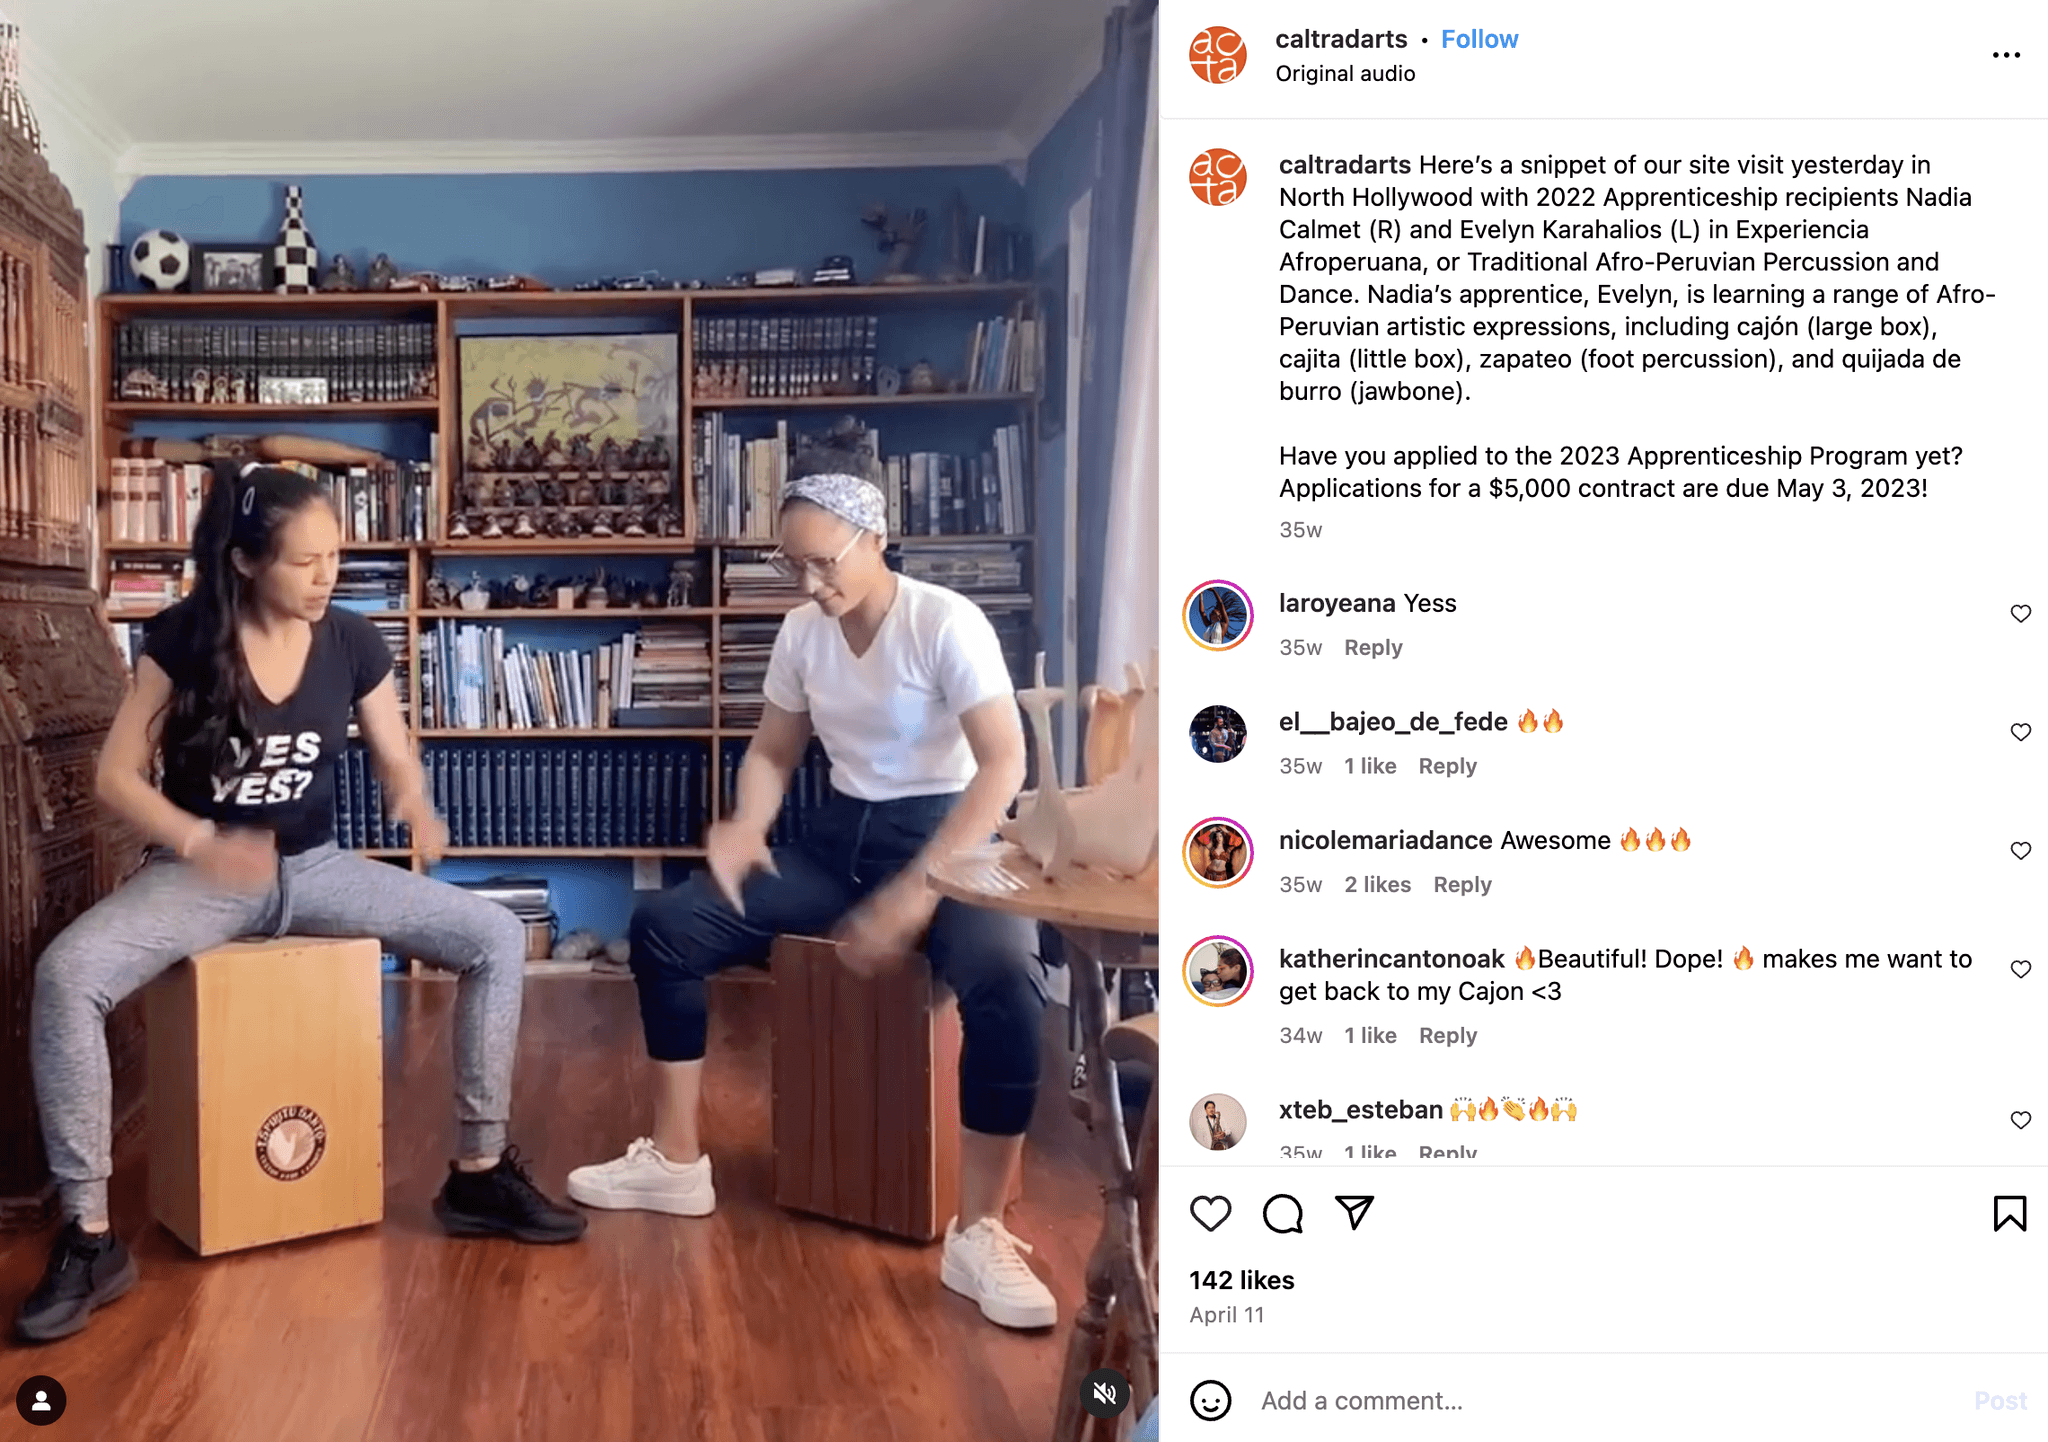
Of the eight posts that were made on the @caltradarts account over July 2023 - December 2023, the posts garnered an average of 39 likes. However, when looking just at the five less “designed” posts, the average number of likes jumps up to 46 likes, an 18% increase. These numbers indicate a trending preference for posts that prioritize visual content and minimize the appearance of words.
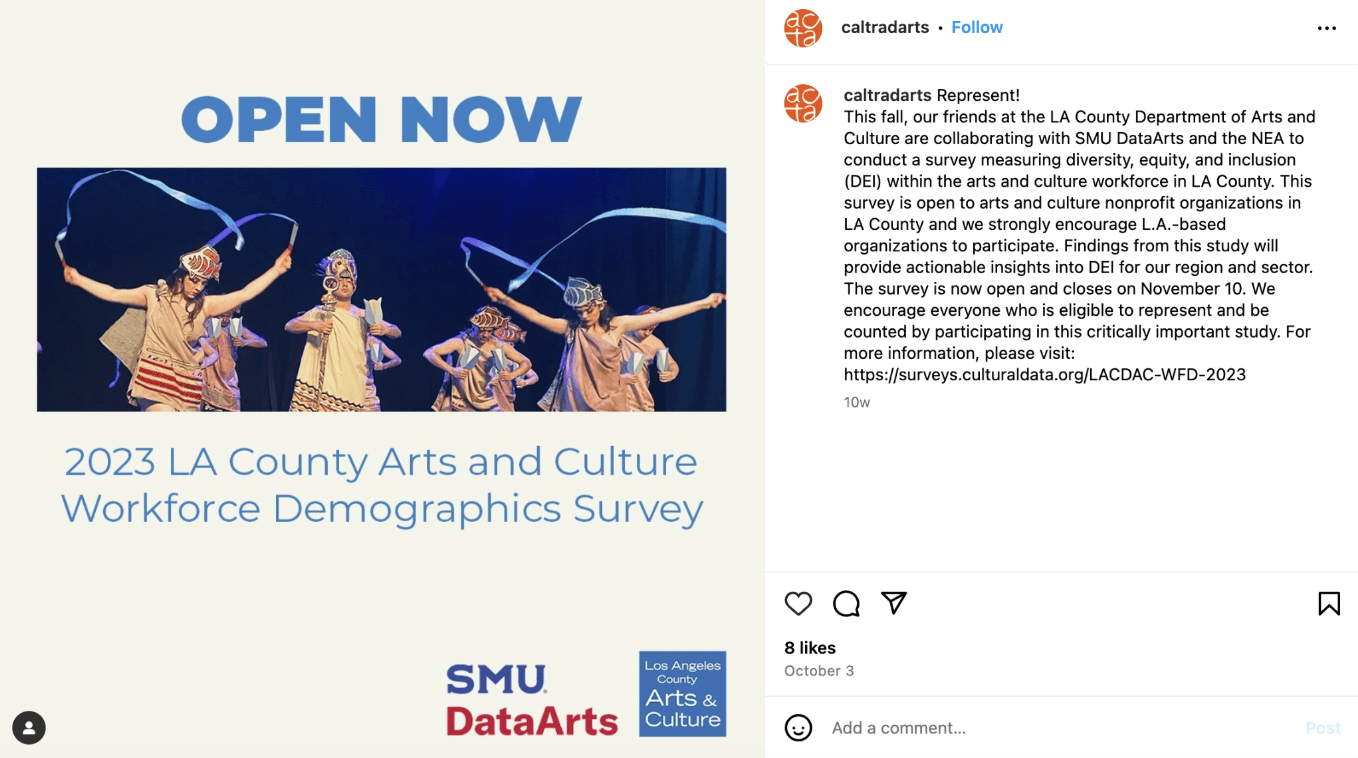
Users prefer posts about the ACTA community compared to posts that are a call to action
Of those eight posts, two posts were calls for audience action. These two posts garnered an average of 15 likes and 285 total impressions. Comparatively, the average number of likes of the six posts that did not call for audience action was 47 likes, with even the least liked post of the six garnering 24 likes. Similarly, the average number of total impressions across the six posts that did not call for audience action was 608 impressions. These numbers represent over 3x the amount of average likes, and over 2x the amount of average impressions for posts that convey information about the ACTA community as opposed to calling for audience action.
RECOMMENDATION 5
Leverage the ACTA Instagram primarily as a place to share information about the community
We recommend using the Instagram channel primarily as a tool highlighting the members of the ACTA community and their stories - these could be anything from employees, organizations, artists, communities. The mockup illustrates how these strategies might be implemented for a future grid post on the ACTA Instagram account.
FINAL PRESENTATION + CLIENT FEEDBACK
Concluding with positive feedback from our client
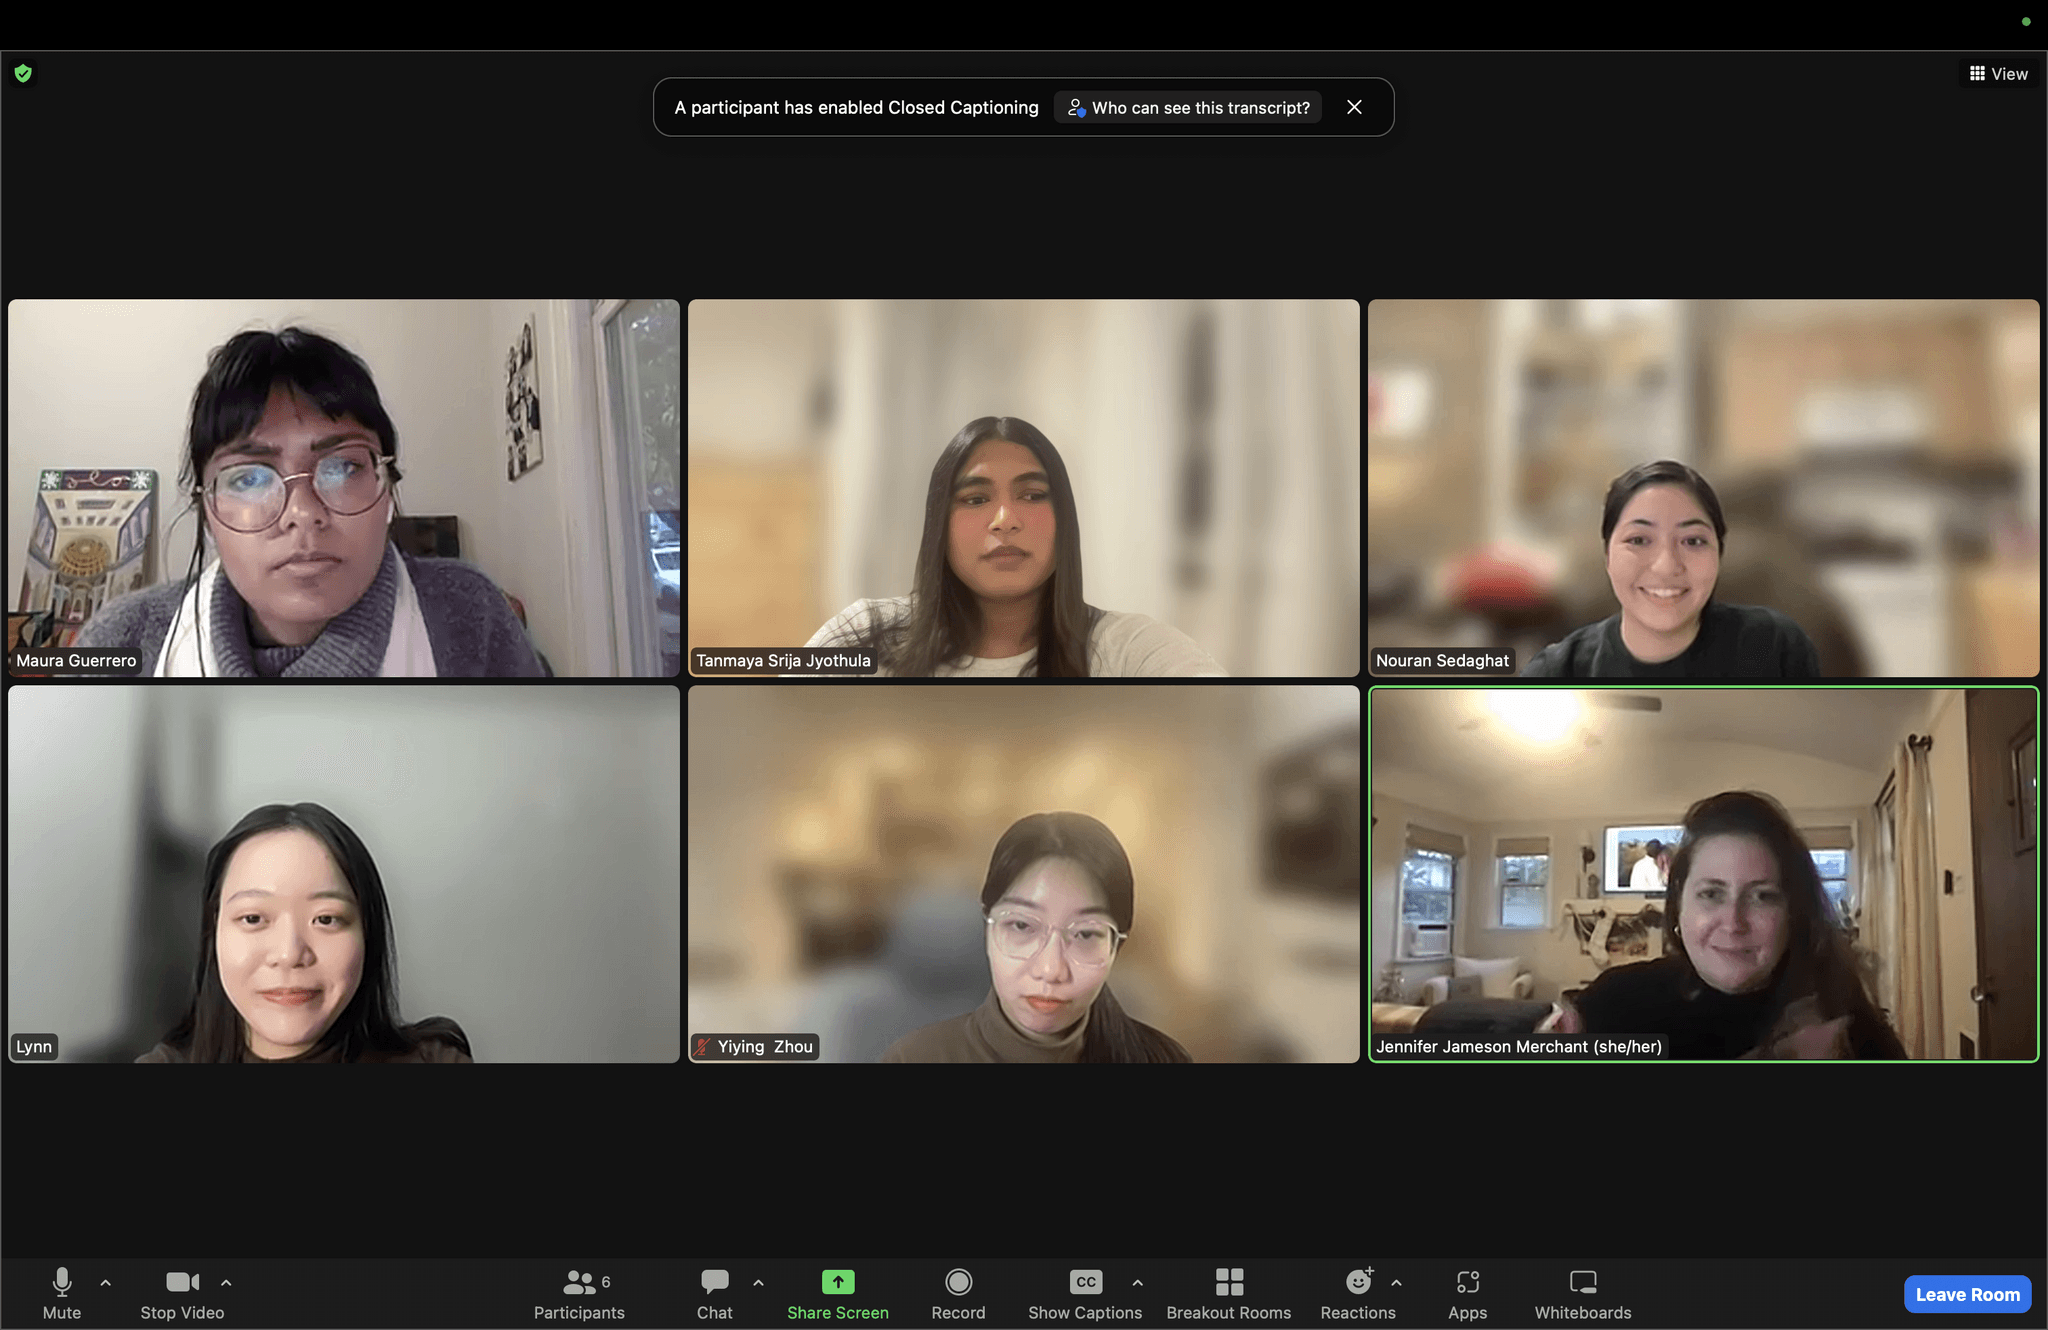
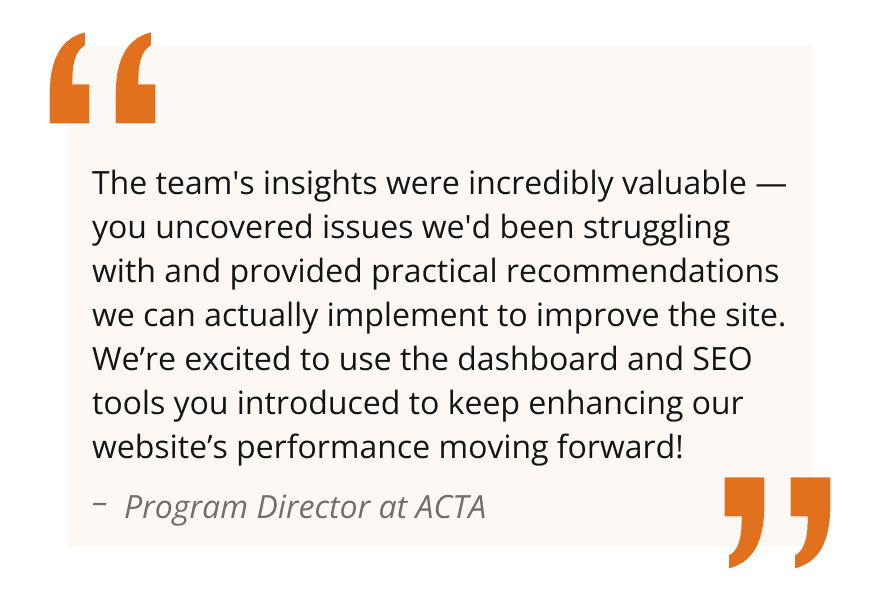
Our team presented our report, slide deck, and dashboard to the client, and they were absolutely thrilled with our work! They were very curious to hear about the various technical performance issues we managed to find. We discussed how they could continue using the dashboard and SEO tools to continue monitoring their website performance.
TAKEAWAYS
If we had more time…
Due to time constraints we were only able to analyze data from Instagram. I would love to do a deeper dive into other forms of social media, to observe their performance and engagement rates.
I would want to conduct usability tests to refine and enhance the user experience based on user feedback and interactions. The project was constrained by incomplete web analytics settings.
I would prioritize optimizing Google Analytics settings and to explore user behaviors through different dimensions. This would provide deeper insights into how we can extend our audience reach across the country.
What I learnt.
I was fascinated by how digital analytics integrated seamlessly into website audits, user behavior research, and quantitative data. Analyzing the analytics independently for the first time gave me deeper insights into how web metrics and KPIs align with broader organizational goals.
Google Analytics provides insights into where users click, how often, and the devices, browsers, and paths they use to reach the site, among other quantitative data. However, it doesn’t reveal user motivations or usability challenges, making this data more impactful when combined with a usability study.
